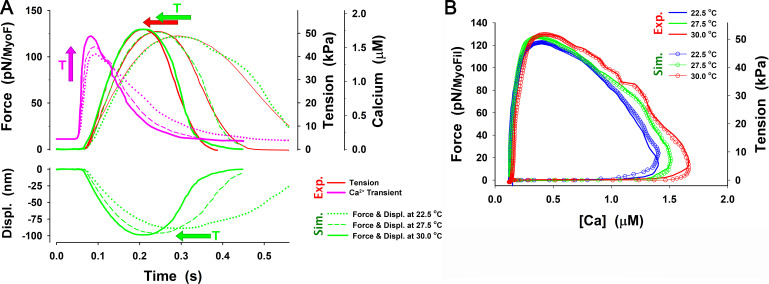
Figure 6.
The effect of temperature on twitch transients. (A) The MUSICO simulation with the six-state model (green lines) matched well the force responses (red lines) at 22.5°C, 27.5°C, and 30°C (Janssen et al., 2002). The rise of temperature increased peak [Ca2+] and relaxed [Ca2+] faster (pink lines). The tension transients showed faster rise times, modest increase in peak force, and a fast relaxation phase, reflecting the changes in patterns of calcium transients with the increase of temperature. The arrows signify these trends with increase of temperature. In addition, the good match of the experimental observations required increase in binding and ADP release rates with increasing temperature (Table 2). (B) The same data plotted as force or tension versus [Ca2+] (in μM) following the observations of Janssen et al. (2002).

