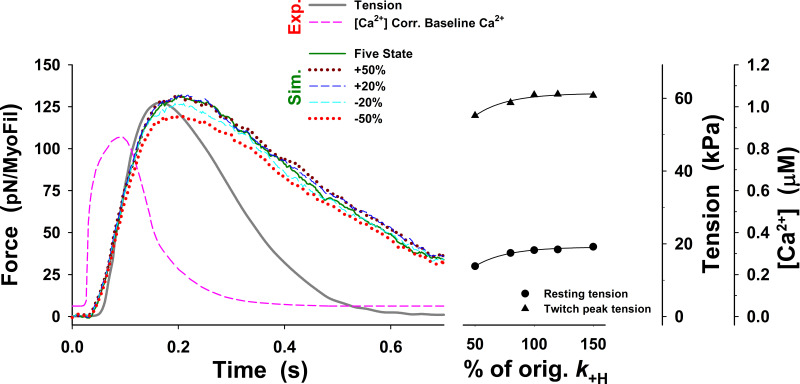
Figure S18.
Changes in twitch tension predicted by the five-state model for change in up to ±50% from those used in Fig. 3 (dark green line), denoted as orig. The main effect of changes in on the tension responses are displayed in modest changes in the peak tension, resting tension, the rate of tension rise, and the rate of relaxation. For all values of the rate of relaxation is about twofold slower than that observed.

