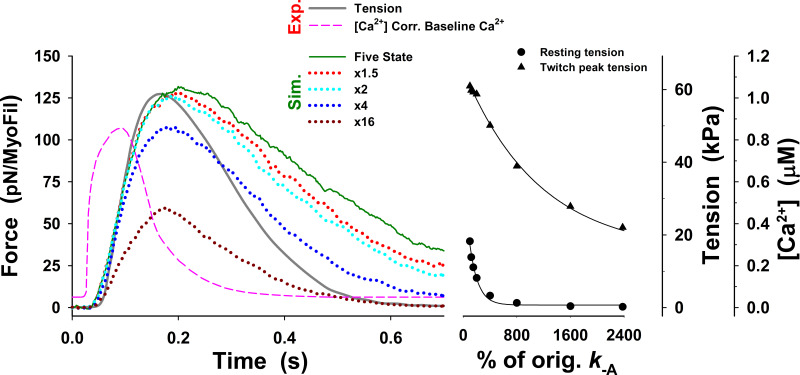
Figure S19.
Changes in twitch tension predicted by the five-state model for change in up to 24-fold from those used in Fig. 3 (dark green line), denoted as orig. The main effect of changes in on the tension responses are displayed as changes in the peak tension, resting tension, and the rate of tension rise. There are two distinctive regions in the peak and resting tensions: (1) the peak tensions modestly decrease for increase up to twofold and resting tension decreases for increase up to fourfold; and (2) for larger increases in the peak tension rapidly falls, and resting tension reaches very low levels. Similarly, the rate of tension relaxation increases for increase up to fourfold and then decreases. The superscript o is omitted from the figure axis label for clarity.

