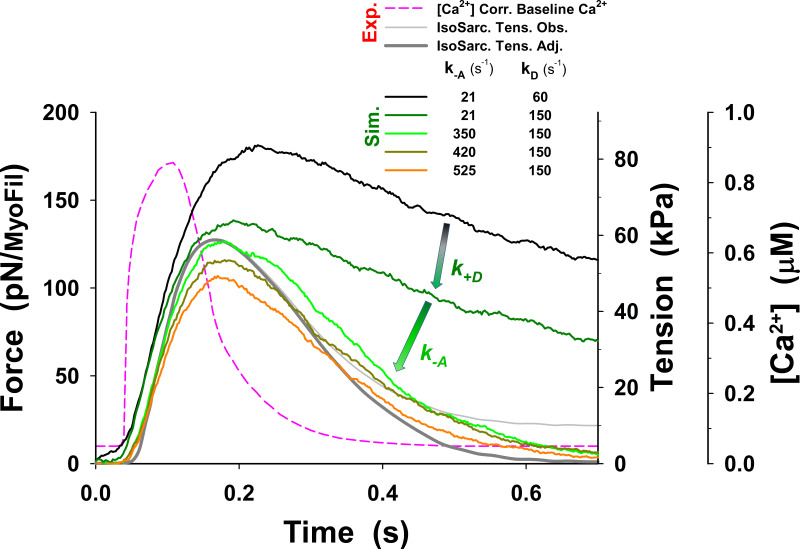
Figure S20.
Changes in twitch tension at isometric half-sarcomere obtained from simulations with the five-state model. The tension transient predicted by the cross-bridge model without the PS, using parameters estimated by the best fit with the six-state model (Fig. 3 and Table 2 at 27.2°C) shows much higher peak tension and slow relaxation (black line). Increase of by 2.5-fold significantly decreased peak tension (dark green line) and, in addition, increase of for ∼17-fold brings the peak tension to the observed level, significantly increasing the rate of the relaxation (green line), but it is still not sufficient to reach the observed rate (gray line). Further decreasing decreased the peak tension and slowed the relaxation rate. The superscript o is omitted from the figure display for clarity.

