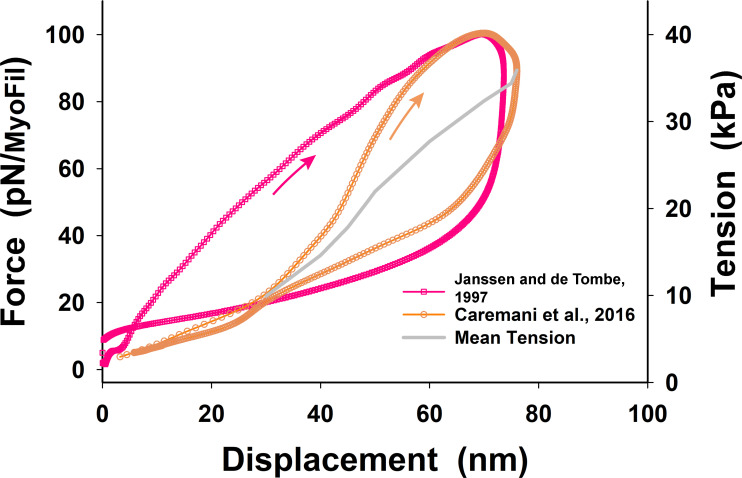
Figure S5.
Comparative tension–displacement loops obtained from Janssen and de Tombe and Caremani et al. (red and orange symbols and lines, respectively). Related to Janssen and de Tombe, 1997; Caremani et al., 2016. Both loops indicated viscoelastic behavior showing higher tension during shortening and lower tension during relaxation accompanied with lengthening. In both cases, the peak force per myofilament and maximum shortening were about the same, but Janssen and de Tombe’s loop is much wider and more asymmetric about the mean value than that of Caremani et al. (see also Fig. 4 B). The Janssen and de Tombe loop (red line) also shows a large drop in tension after reaching maximum shortening and, after the drop in tension, relaxes slowly during lengthening, having a higher value of tension than the initial value at displacement <4 nm. This deviation of the descending part of the loop shows some uncertainty in the measurements compared with that of Caremani et al. Thus, for simplicity, we derived a nonlinear serial springlike elasticity from Caremani et al.’s average tension–displacement relationship (thick gray line) that shows more consistent behavior at displacement <40 nm and a nicely rounded loop at the tip of shortening. Because the conversion factor between force per myofilament and tension depends on the length at which the trabecula cross-section was measured, the corresponding tensions are shown in red letters for Janssen and de Tombe’s loop and in orange letters for Caremani et al.’s loop.

