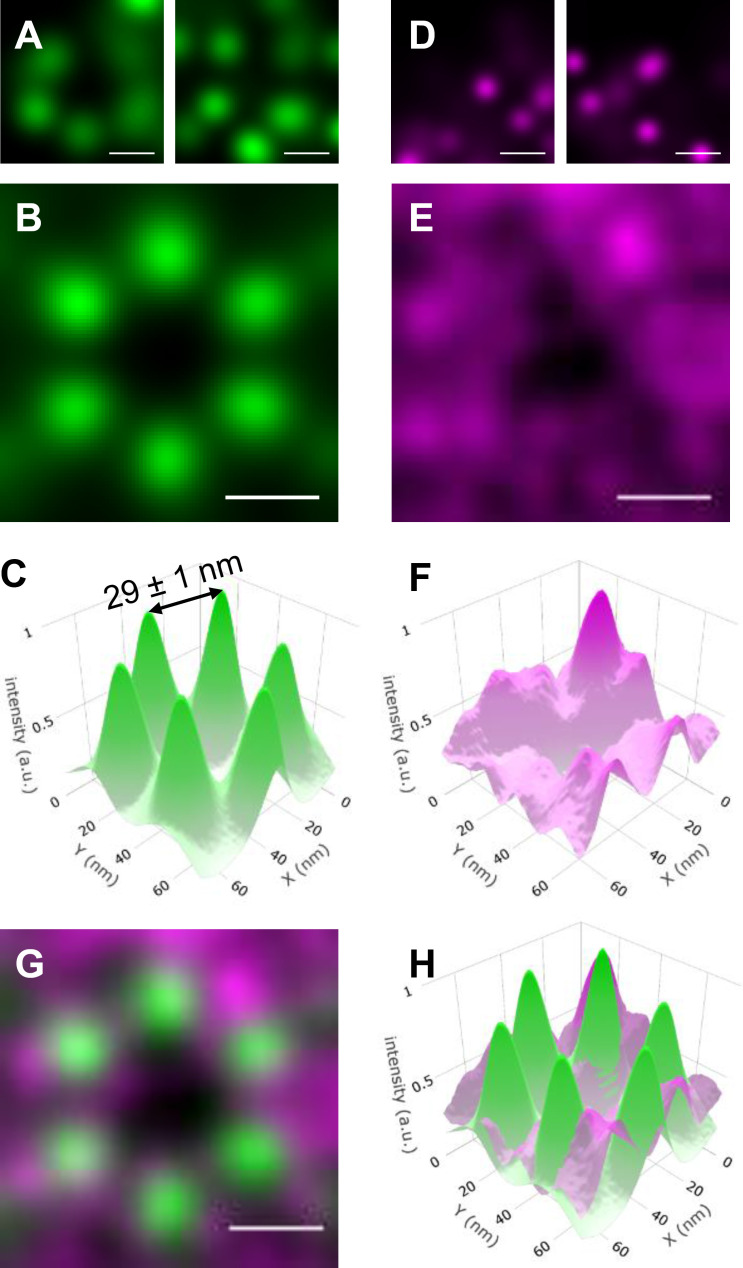
Figure 3.
Relative positions of actin and MyBP-C in sarcomeres from active muscle preparations determined by combining STORM with particle averaging. (A) Examples of partial hexagons cropped from active muscle sarcomeres in the actin STORM images. (B) Average reconstructed actin fluorescence image generated from 120 actin ROIs originating from different sarcomeres. (C) 3-D plot of the average actin image shown in B, with the z axis (intensity) representing localization certainty. The distance between two neighboring actin filaments was 29 ± 1 nm. (D) ROIs of the MyBP-C reconstructed images cropped from areas identical to those shown for actin in A. (E) Average reconstructed MyBP-C image, as in B for the actin. (F) 3-D plot of the average MyBP-C image shown in E. (G) Merged images shown in B and E. Actin (green) and MyBP-C (magenta). (H) Merged 3-D images shown in C and F. Actin (green) and MyBP-C (magenta). Scale bars, 25 nm. a.u., arbitrary unit.

