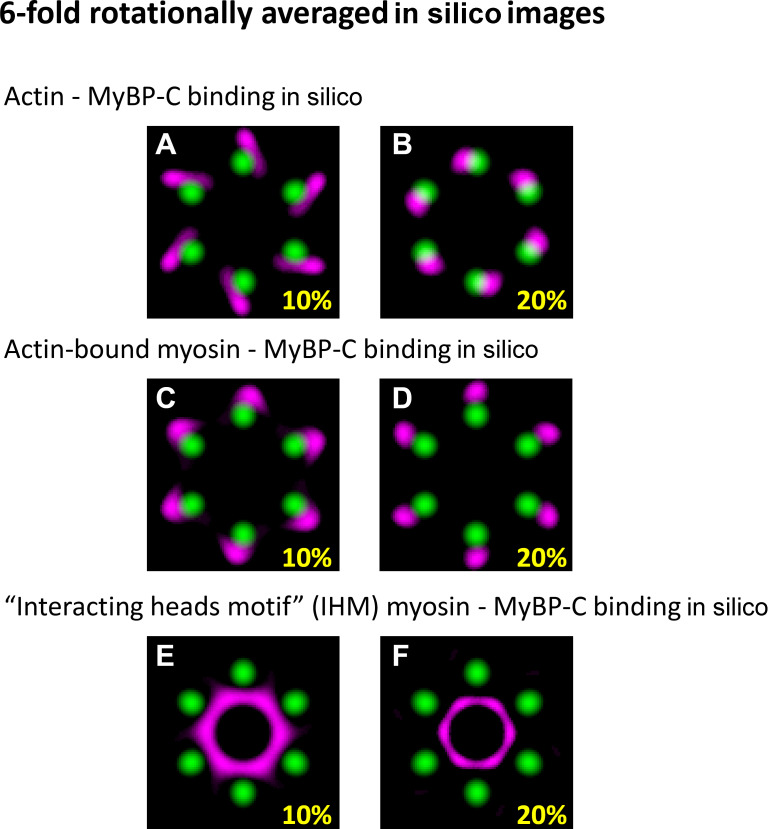
Figure S10.
Comparison of the sixfold rotationally averaged in silico images. (A and B) Rotational averages for in silico images representing 10% and 20% of MyBP-C molecules bound to actin. (C and D) The myosin heads when myosin is attached to actin. (E and F) Myosin heads adopting the IHM. The unbound MyBP-C molecules were randomly distributed in the free space between the myosin thick and actin thin filament surfaces under all conditions. Brightness and contrast in all images were adjusted to highlight the regions with highest probability of occupancy for MyBP-C.

