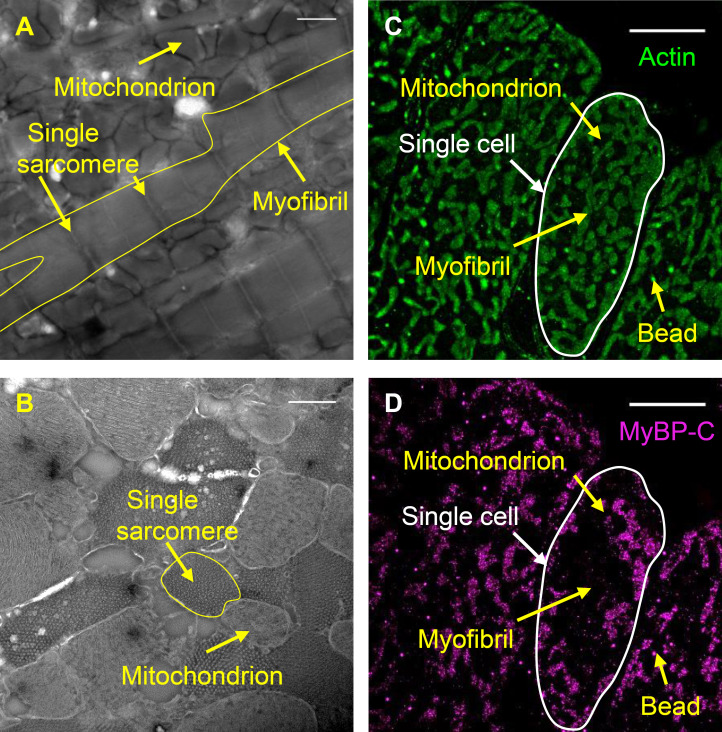
Figure S2.
Longitudinal and cross-sectional views of mouse cardiac papillary muscle. (A and B) Negative-stain EM images of 100-nm-thick cryo-sections, longitudinal (A) and transverse (B), of mouse papillary muscle from active and relaxed muscle preparations, respectively, demonstrating the actin and myosin filament lattice within the myofibrils. Scale bars, 1 µm (A) and 500 nm (B). (C and D) Reconstructed images of Alexa Fluor 488-phalloidin (actin) filaments (C) and Alexa Fluor 647 anti-myc (MyBP-C’s C0 domain; D) within 400-nm-thick transverse cryo-sections of mouse papillary muscle imaged by STORM. Scale bars, 5 µm.

