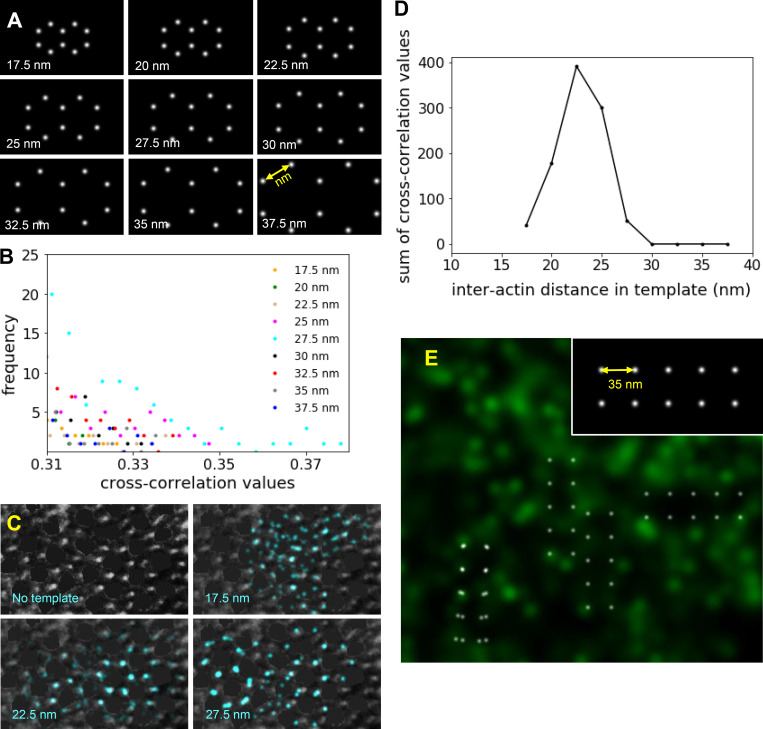
Figure S3.
Identification of myosin and actin lattice and quantification of interactin spacing in actin STORM and EM images. (A) Templates containing two identical adjoining hexagons with different interactin spacing (17.5–37.5 nm) used in template matching by cross-correlation analysis. (B) The tail of the distribution of cross-correlation values indicative of cross correlations with the highest values. Such values were summed from analysis of 45 sarcomeres and plotted to determine the best fits (Fig. 2 F). (C) The highest cross-correlation values from the cross correlation of a negatively stained EM image of transverse papillary muscle with 17.5-, 22.5-, and 27.5-nm hexagonal templates. The intensities from the thick filaments were removed from the image using the brush tool in ImageJ (Schneider et al., 2012) to mimic the STORM images. The template matches with 22.5-nm interactin distances (blue points) overlapped with one another, highlighting the region of the sarcomere with particularly good preservation of the myosin and actin filament lattice. (D) The sum of greatest cross-correlation values resulting from cross correlation of the two-hexagonal templates of various sizes (range, 17.5–37.5 nm) with the EM images demonstrated a maximum for the template with 22.5-nm interactin spacing. (E) The highest cross-correlation values between an actin STORM image and a four-square template with a side length of 35 nm (inset) did not overlap with one another, as shown in Fig. 2 F for the two-hexagonal template.

