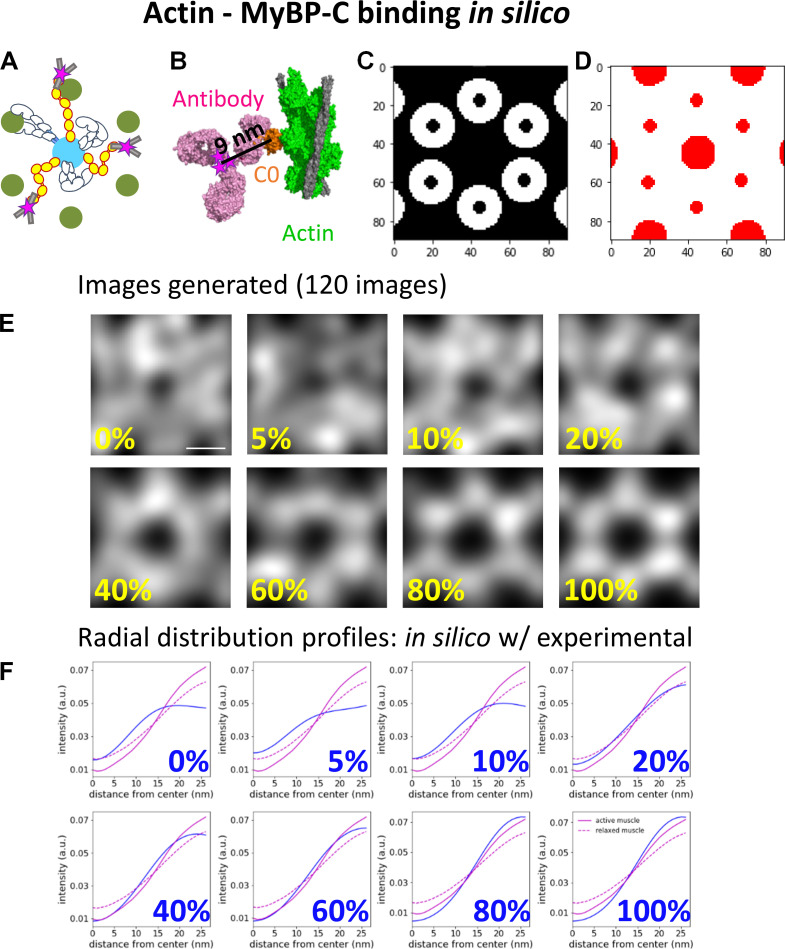
Figure S7.
Comparison of the radial intensity profile of MyBP-C fluorescence from the center of the actin hexagon in active and relaxed sarcomeres to in silico models with MyBP-C bound to actin. (A) Illustrative representations of MyBP-C bound to actin. (B) The high-resolution cryo-EM structure of MyBP-C’s C0 domain (orange) bound to a cardiac thin filament (green; PDB accession no. 6CXI). The binding domain of an antibody (magenta; PDB accession no. 1IGT) was placed in close proximity to the C0 domain, and the fluorophores (represented as magenta stars) were added to the cysteines presumed to be accessible for direct conjugation of the Alexa Fluor dyes. Six fluorophores were expected to be bound to a single antibody. (C) White areas are target zones for random placement of the fluorophores for when MyBP-C is bound to the actin, as shown in A, for in silico models. (D) Red areas are regions of the image in which fluorophores cannot be randomly placed due to steric exclusion from the myosin and actin filaments. (E) Average in silico reconstructed images generated with a fraction of the fluorophores bound to actin and the remaining fluorophores randomly distributed throughout the image except for the red areas shown in C. Each image is an average of 120 individual simulations. Scale bar, 25 nm. (F) The radial intensity profiles for the position of MyBP-C relative to the center of the average actin hexagon in the active (solid magenta) and relaxed (dotted magenta) sarcomeres and in silico images shown in E (blue); cf. Fig. 4 C. a.u., arbitrary unit.

