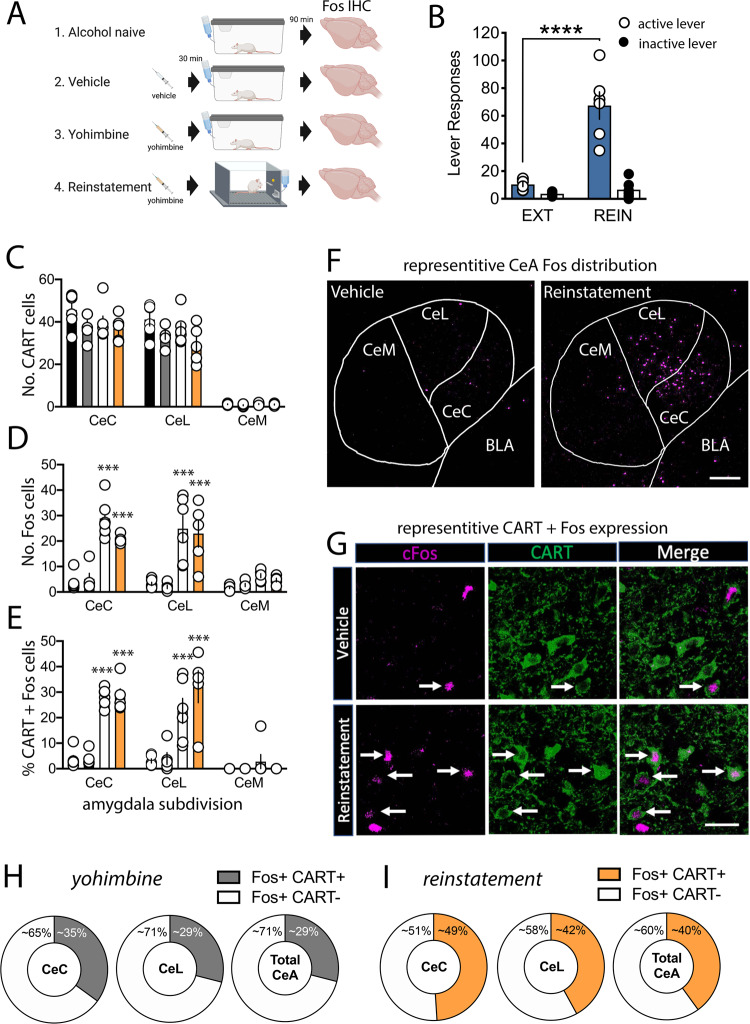
Fig. 2. Yohimbine-induced reinstatement of alcohol seeking activates CART neurons within the CeA.
a Timeline for alcohol operant training and testing prior to Fos analysis. b Active (open circle) and Inactive lever (closed circle) responses during the last three sessions of extinction (EXT) and yohimbine-induced reinstatement of alcohol seeking (REIN) for the reinstatement test group. RM two-way ANOVA, active lever, EXT vs. REIN, ****p < 0.0001. c No difference in the number of CART neurons expressed in the capsular (CeC), lateral (CeL) or medial (CeM) divisions of the CeA were observed between alcohol naïve (NAV), vehicle (VEH), yohimbine-treated (YOH) or rats which underwent yohimbine-induced reinstatement of alcohol seeking (REIN). d Increased expression of Fos in CeC and CeL, but not CeM divisions of the CeA were observed in YOH and REIN rats compared to NAV and VEH controls. e Increased percentage of CART+ cells that co-express Fos were observed in the CeC and CeL, but not CeM of YOH and REIN rats compared to NAV and VEH controls. f Representative confocal images comparing Fos expression throughout the CeC, CeL and CeM divisions of VEH and REIN rats. g High magnification representative confocal images comparing Fos and CART expression within the CeA of VEH and REIN rats. h Following yohimbine administration in the homecage (YOH), CART+ neurons represent ~35% of Fos+ neurons in the CeC, ~29% of Fos+ neurons in the CeL and ~29% of all CeA Fos+ neurons. i Following yohimbine-induced reinstatement of alcohol seeking (REIN), CART+ neurons represent ~49% of Fos+ neurons in the CeC, ~42% of Fos+ neurons in the CeL and ~40% of all CeA Fos+ neurons. Two-way-way ANOVA, ***p < 0.001, n = 5–6/group. Data are expressed as mean ± SEM. BLA basolateral amygdala, IHC immunohistochemistry. Scale bars = 250 μm (F) and 50 μm (g).

