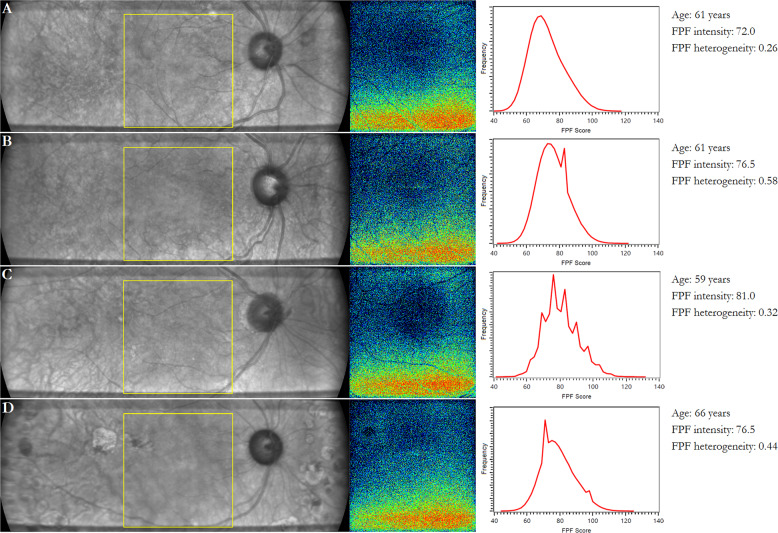
Fig. 4. Infrared (IR) and flavoprotein fluorescence (FPF) images of healthy control and diabetic eyes.
Representative images of a healthy control, b diabetes without retinopathy, c mild–moderate nonproliferative diabetic retinopathy, and d proliferative diabetic retinopathy. (Left) IR fundus image. The yellow box indicates the region where FPF is measured. (Center) FPF heat map. Warmer colors represent higher FPF intensities. (Right) Distribution of FPF intensities among all image pixels.

