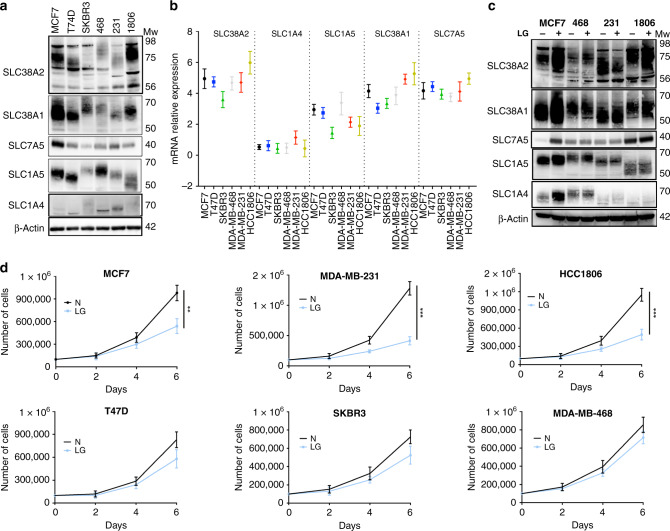
Fig. 1. Glutamine dependency and glutamine transporters expression in breast cancer cell lines.
a Immunoblotting of extracts from six different breast cancer cell lines to assess the levels of different glutamine (Gln) transporters. β-actin is shown as a loading control, n = 3. b Plot of SLC38A2 mRNA levels (Y-axis) in six breast cancer cell lines (X-axis). Each dot represents the mean mRNA level of each AAT in a specific cell line after normalisation to housekeeping genes (β-actin and RPL11). N = 3. c Immunoblot analysis from MCF7, MDA-MB-468, MDA-MB-231 and HCC1806 cultured in normal (N, 4 mM) and in low glutamine medium (LG, 1 mM) for 24 h. d Breast cancer cell lines were grown in media with complete (N) or low Gln (1 mM, LG) in 10% dialysed FBS. The number of live cells per well was counted at day 2, 4 and 6. Error bars indicate SD. **P < 0.01, ***P < 0.001; unpaired t-test. N = 3.

