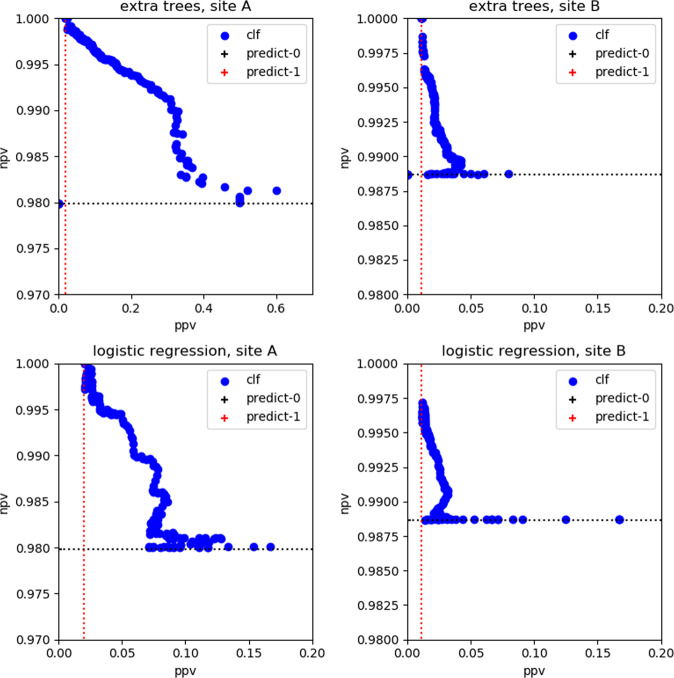
Fig. 4. Positive predictive values (PPV) versus negative predictive values (NPV) for the random forest classifier (1st row) and logistic regression classifier (2nd row) in Site a (1st column) and Site b (2nd column) for a single split.
Each blue point corresponds to a different operating point (threshold) of the classifier.

