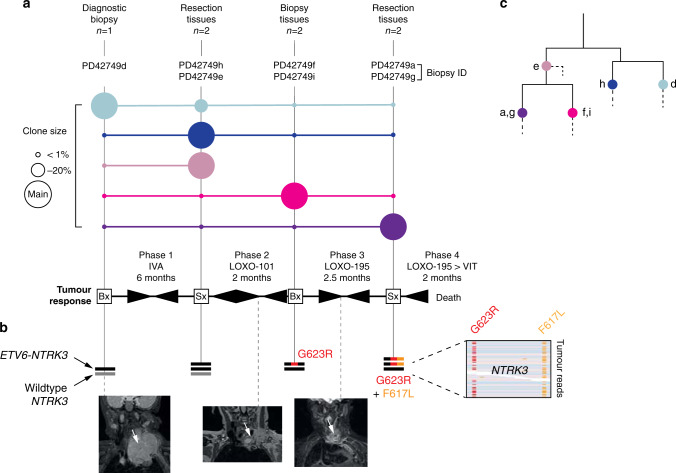
Fig. 1. Evolution of multi-TRK resistance.
a Clonal composition of tumour tissues over the course of illness. Coloured circles denote the clonal composition of tissues sequenced at a given time point. The scale of a clone’s contribution to these samples is relative to a circle’s size; larger circles indicate a greater contribution by that clone. Beneath this is a simplified overview of principal systemic therapies and the resultant tumour responses. IVA ifosfamide, vincristine, actinomycin D, VIT vincristine, irinotecan, temozolomide, LOXO-101 (larotrectinib) first-generation TRK inhibitor, LOXO-195 (selitrectinib) second-generation TRK inhibitor. Arrowheads tapering from left to right indicate partial/complete tumour response and vice versa for progression. b Sequence of somatic alterations of NTRK3. Black line: ETV6-NTRK3 fusion. Grey line: wild-type copy of NTRK3. Number of lines corresponds to copy number. Screen capture on the right shows the co-occurrence of both resistance mutations on the same tumour sequencing reads. At the bottom are three coronal MRI images of the tumour (white arrow): one at diagnosis (left) and two demonstrating the tumour’s best response to LOXO-101 (middle) and LOXO-195 (right). c Phylogenetic tree of tumour lineages. Solid lines: major branches where mapped mutations revealed the relationship of the clones identified. Labelled overlying coloured circles represent the clones shown in panel a. Dashed lines: private mutations that did not inform tree building.

