
Fig. 1. Overview of sample distribution within the project per site.
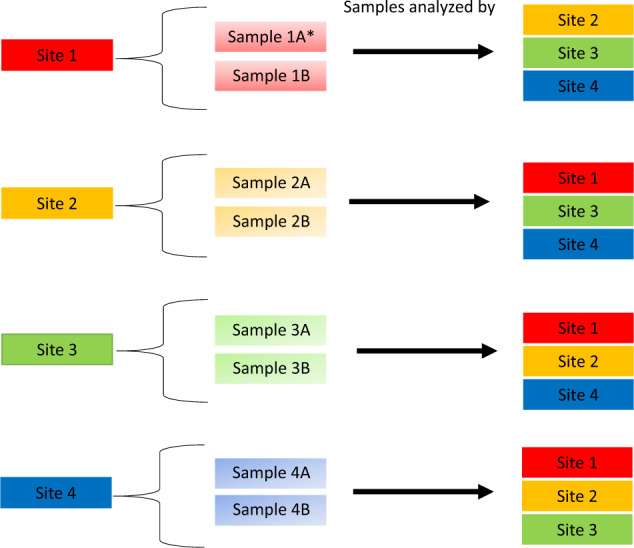
Each site sent one sample with confirmed genetic diagnosis (represented as a) and one sample with unknown genetic diagnosis (represented as b) to three other sites, and received six samples from the other sites.