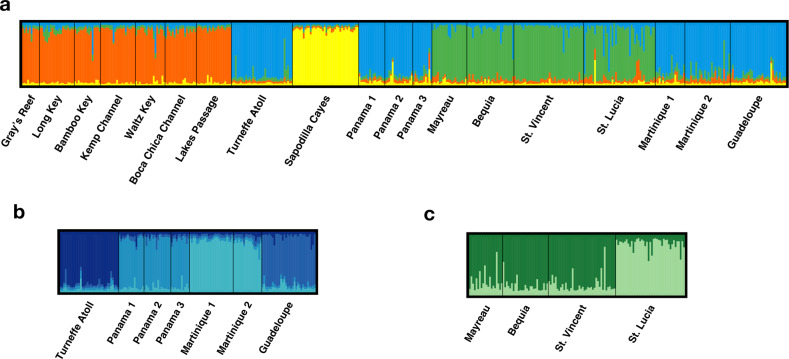
Fig. 3. Geneland plot showing genetic clusters and individual admixture proportions in Ircinia campana.
Each bar represents an individual; colours represent genetic cluster identity, and bar heights represent inferred membership proportions to genetic clusters. The analysis was firstly carried out over all sites, showing K = 4 genetic clusters (a); separate analyses were subsequently conducted on multisite clusters identified therein (b, c), showing K = 4 (b) and K = 2 (c) genetic clusters. Analysis on the USA cluster yielded K = 1 (data not shown).

