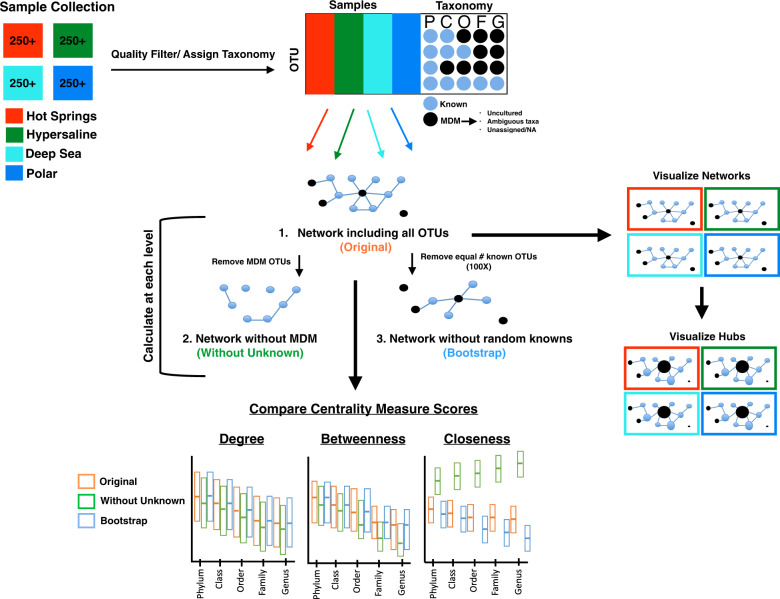
Fig. 1. Overview of the analysis pipeline.
A minimum of 250 samples was retrieved for each of the four different extreme environments—hot springs (red), hypersaline (dark green), deep sea (turquoise), and polar (blue). Sequence reads were quality filtered, assigned to a taxonomy, and clustered to OTUs. At each classification level, any unassigned, ambiguous, or uncultured OTUs were designated as Unknowns, or “microbial dark matter” (MDM). For each environment, at each classification level, the direct co-occurrence relationship between all OTUs was mathematically modeled as a network. Networks were created for each environment, across all taxonomic classification levels, including all OTUs (Original, orange), excluding MDM (Without Unknowns, light green), and excluding an equal number of random Knowns (Bootstrap, blue). Network centrality metrics (i.e., degree, betweenness, and closeness) were calculated for each node, compared, and visualized as boxplots between these network types. Hub scores were calculated for each node in the Original network and networks were recreated, resizing by hub score, where the largest size node indicates a top hub species.

