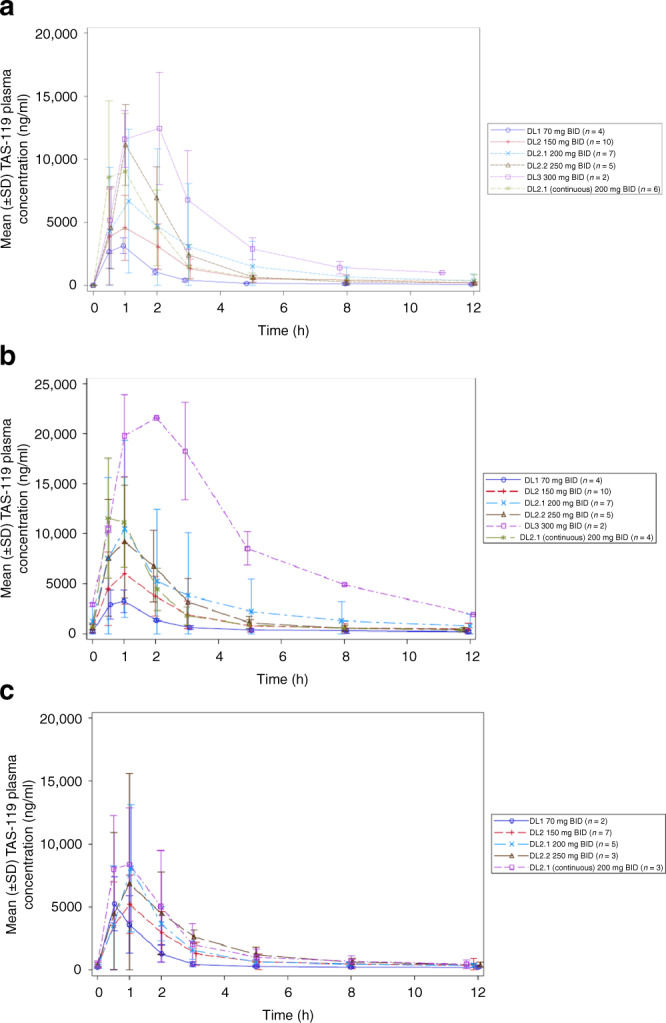
Fig. 1. Mean (±SD) plasma concentration versus time curves (linear scales) for TAS-119.

a Cycle 1 day 1. b Cycle 1 day 4. c Cycle 1 day 18. A total of 34 patients were evaluable for PK data. In 2 patients, parameters from one pre-dose sample and one day 4 sample, respectively, were unavailable. Parameters collected on a non-predefined day (2 patients) or collected from patients with dose omissions (2 patients) or dose reductions (1 patient) were excluded.
