
Fig. 2. Scatterplots of TAS-119 parameters (Cmax and AUC0 − last) versus dose on cycle 1 day 1.
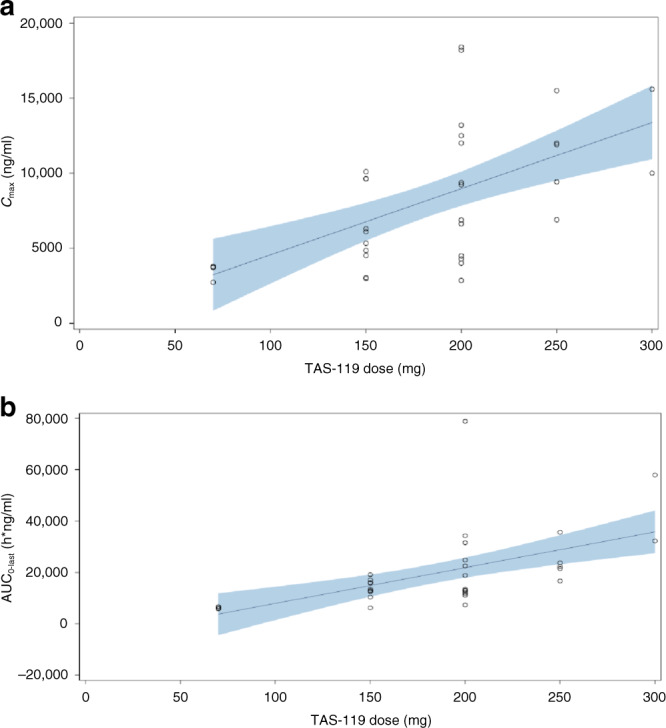
a Cmax versus dose in cycle 1 day 1. b AUC0-last versus dose in cycle 1 day 1. AUC0 − last = area under the plasma concentration–time curve from time 0 to the time point of last observable concentration, Cmax = maximum observed plasma concentration, PK pharmacokinetics. Note: Each symbol represents individual PK parameters. The regression curve was provided by the linear model. The shaded area indicates 90% confidence band.