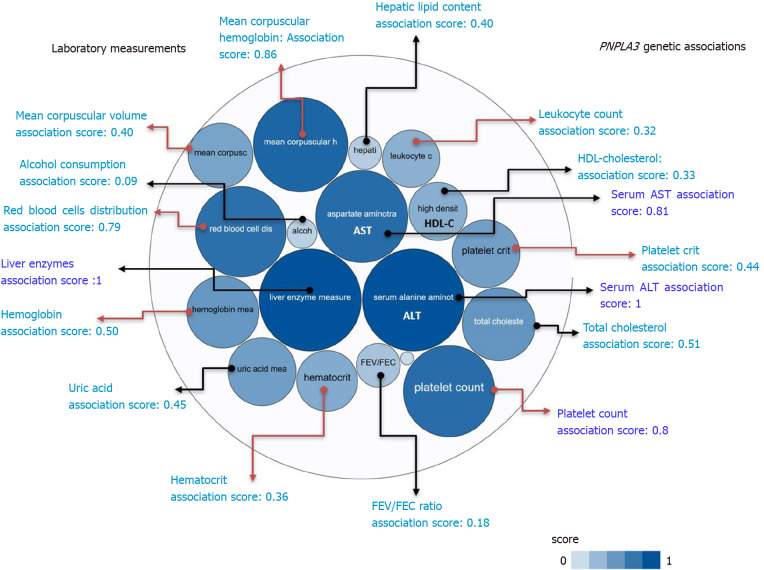
Figure 2.
PNPLA3 and genetic associations with laboratory measurements in genome-wide association studies and phenome-wide association studies. The score for the associations ranges from 0 to 1, with higher scores indicating stronger evidence for an association. Bubbles in the figure represent the different scores with varying shades of blue: the darker the blue, the stronger the association. Red arrows highlight the association of the rs738409 variant in PNPLA3 and laboratory measurements related with hematological traits. HDL: High density lipoprotein cholesterol; FEV: The ratio of forced expiratory volume to forced vital capacity, used as a measure of pulmonary function; uric: Uric acid; AST: Aspartate aminotransferase level; ALT: Alanine aminotransferase level; total chol: Total cholesterol. Source: Open Target Database (https://genetics.opentargets.org/gene/ENSG00000100344). Score summaries: Data sources and factors that affect the relative strength of the evidence scores can be found at: https://docs.targetvalidation.org/getting-started/scoring.

