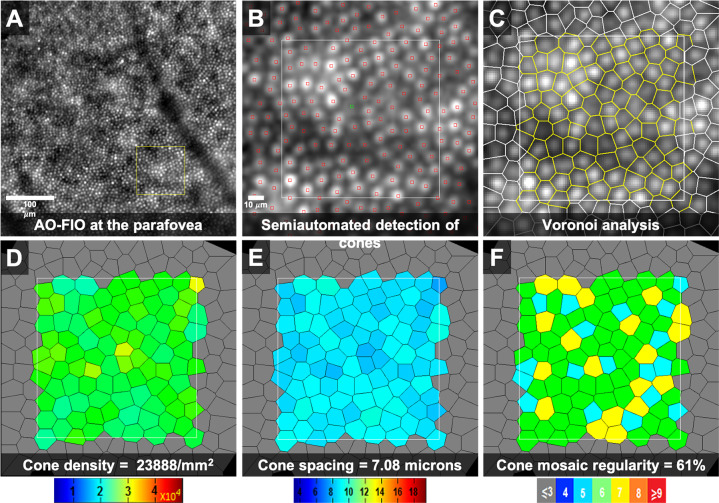
Fig. 2. Adaptive optics flood illumination ophthalmoscope (AO-FIO, rtx1, Imagine Eyes) imaging of the cone photoreceptor mosaic in the right eye of a 36-year-old female healthy volunteer.
Quantitative analyses were performed on the AODetect software (Imagine Eyes). a 0.5 × 0.5 mm image captured at a location 2 degrees temporal to the centre of the fovea. The area inside the yellow square was enlarged in b–f to extract measurements. b The centre of cones was identified automatically (small red squares) and then validated/corrected by a human grader (green square). Voronoi analysis of the cone mosaic (c) was performed to calculate and construct colour-coded maps of cone density, spacing and regularity (d–f, respectively).

