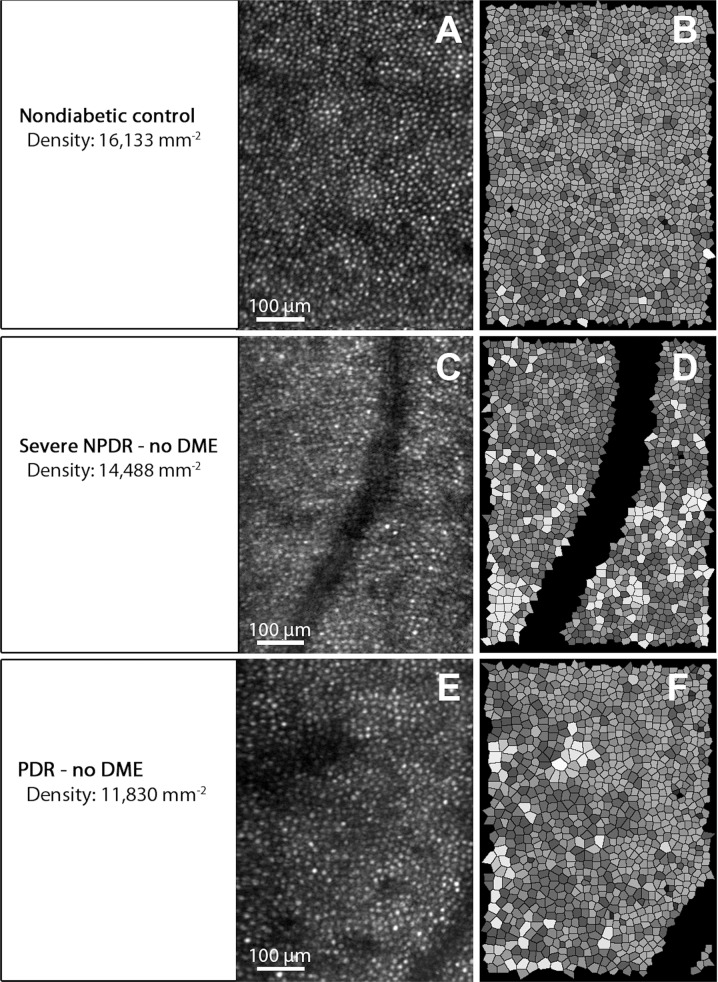
Fig. 5. Adaptive optics scanning laser ophthalmoscope (AO-SLO) imaging of photoreceptors in a healthy subject and diabetic patients.
a, c, e Cone reflection images. b, d, f Voronoi analysis of cone photoreceptors in (a, c, e), respectively. Upper row: densely packed cone photoreceptors in a healthy control subject. Middle and lower rows: reduced cone density and increased irregularity in the cone mosaic in patients with diabetic retinopathy. Reprinted with permission from Lammer et al. [152].

