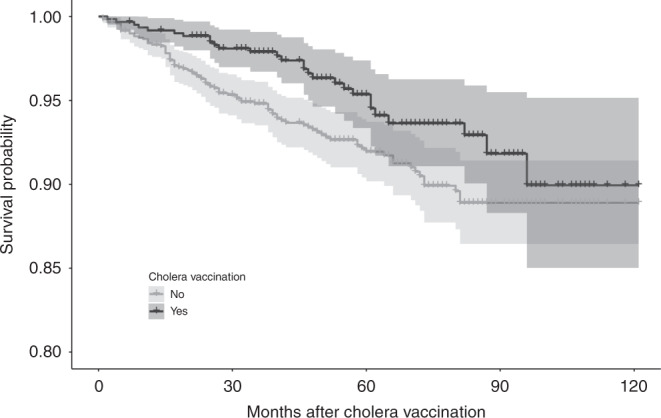
Fig. 2. Kaplan–Meier plot for disease-specific survival stratified by cholera vaccination.

The area within the band is the confidence interval of the survival probability.

The area within the band is the confidence interval of the survival probability.