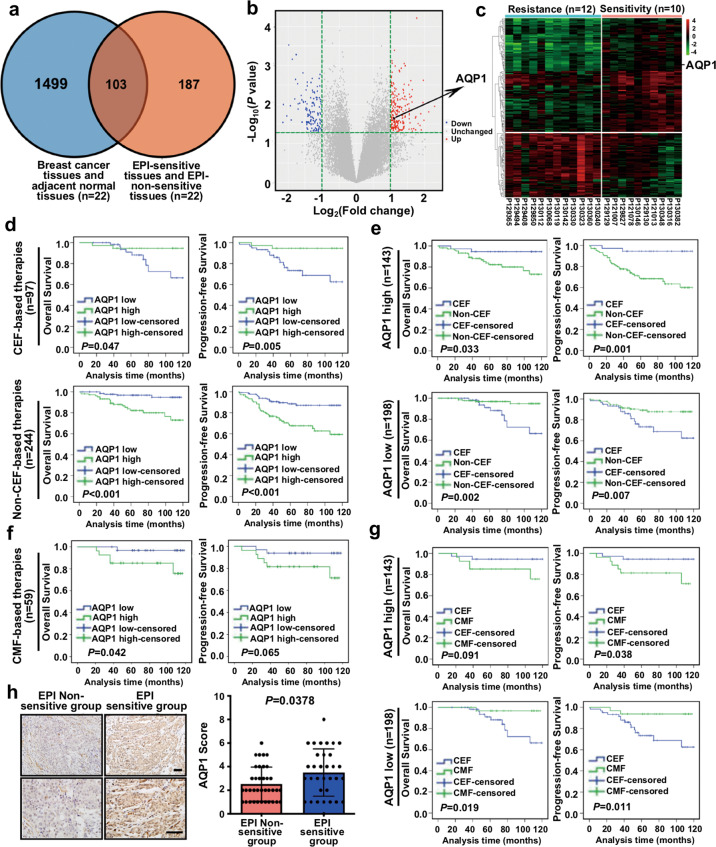
Fig. 1. mRNA microarray combined with bioinformatics analysis and clinical analysis demonstrated that AQP1 upregulated EPI chemosensitivity.
a The Venn diagram showed DEGs in breast cancer tissues and their paired adjacent tissues. DEGs in EPI sensitive group and non-sensitive group, along with 103 overlapped DEGs were also shown. Genes with P < 0.05 and |fold change| > 2 were considered as DEGs. b The volcano plot: green, red, and black points represented downregulated (n = 105), upregulated (n = 185), and no statistically significant difference genes, respectively, in the EPI non-sensitive group versus the EPI sensitive group. X-axes showed log2 (fold change) and y-axes showed −log10 (P value). c The heatmap and cluster analysis: EPI non-sensitive group: blue, EPI sensitive group: pink. Red denoted high expression and green represented low expression. The high expression of AQP1 in EPI sensitive group was shown. Not all DEGs in the figure were labeled. d OS (left panel) and PFS (right panel) curves of IDC patients treated with CEF-based therapies (upper panel) or non-CEF-based therapies (lower panel) with AQP1 expression (log-rank test). e OS (left panel) and PFS (right panel) curves of patients with high expression of AQP1 (upper panel) or low expression of AQP1 (lower panel) who received CEF-based therapies or non-CEF-based therapies (log-rank test). f OS (left panel) and PFS (right panel) curves of IDC patients treated with CMF-based therapies with AQP1 expression (log-rank test). g OS (left panel) and PFS (right panel) curves of patients with high expression of AQP1 (upper panel) or low expression of AQP1 (lower panel) who received CEF-based therapies or CMF-based therapies (log-rank test). h Representative immunohistochemical images of AQP1 expression in the EPI non-sensitive group (n = 37) and the EPI sensitive group (n = 33), respectively. Scale bars: 100 μm, (left panel). The AQP1 expression was higher in the EPI sensitive group than the EPI non-sensitive group (Mann–Whitney U test, P = 0.0378; right panel).

