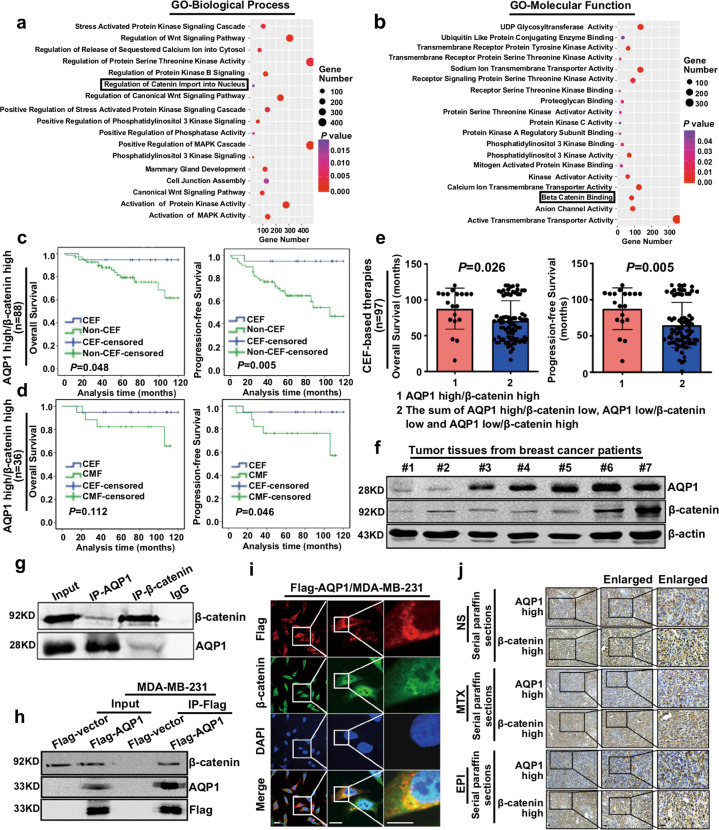
Fig. 3. AQP1 interacted with β-catenin and patients with both high expression of AQP1 and β-catenin presented the best outcomes with the anthracycline chemotherapy.
a, b The 1218 breast cancer patients’ RNAseq data was divided into two groups according to the expression of AQP1. The limma R package was used to calculate the differentially expressed statistics. GO functional annotation genes in the module obtained by GSEA. Y-axis showed the GO terms and x-axis showed the gene number of each term, the degree of color represented P value. c Patients were divided into four subgroups according to the expression of both AQP1 and β-catenin. The AQP1 high/β-catenin high subgroup patients who received CEF-based therapies had a longer OS (left panel) and PFS (right panel) than non-CEF regimens (log-rank test). d The AQP1 high/β-catenin high group who received CEF-based therapies had a longer PFS (right panel) than CMF regimen patients (log-rank test). e The AQP1 high/β-catenin high group showed a longer OS (left panel) and PFS (right panel) in CEF-based therapies patients (n = 97) than the rest (i.e., the sum of AQP1 high/β-catenin low, AQP1 low/β-catenin low, and AQP1 low/β-catenin high; two-tailed Student’s t test). f The expression of AQP1 and β-catenin was detected by western blot using tumor tissues from breast cancer patients. β-actin was the loading control. g, h Co-immunoprecipitation results of AQP1 and β-catenin in breast cancer tissues (g) and Flag-AQP1/MDA-MB-231 cells (h). i Co-localization of Flag-AQP1 and β-catenin in Flag-AQP1/MDA-MB-231 cells. Insets showed a high-magnification view of the indicated region. Scale bars: 100 μm. j The expression of AQP1 and β-catenin was detected by immunohistochemistry analysis of serial paraffin sections in mice tumor tissues. Scale bars: 200 μm. Experiments (f–i) were independently repeated for three times.

