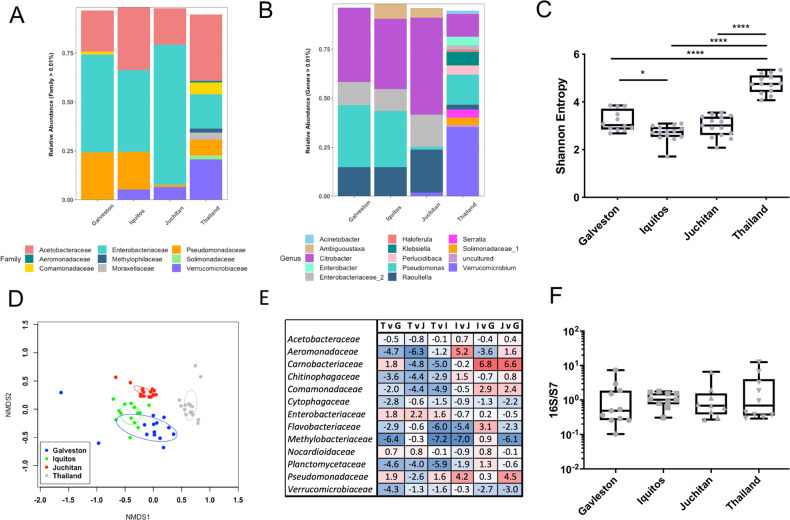
Fig. 3. Microbiome analysis of the Galveston, Juchitan, Iquitos, and Thailand Ae. aegypti lines.
16S rRNA amplicon sequencing was done on female adult mosquitoes 5 days post eclosion. All mosquitoes were reared in the same laboratory environment under identical conditions. The relative abundance of bacterial communities at the family (a) and genus level (b). Alpha (Shannon’s entropy; *p < 0.05, ****p < 0.0001) (c) and beta (NMDS) (d) diversity metrics. Differential abundance analysis (ANCOM) of bacterial families in pairwise comparisons (e) between the four lines (T—Thailand, G—Galveson, J—Juchitan, I—Iquitos). A bolded value indicates a significant difference. Positive value indicates greater adundance of bacteria in the denominator, negative indicates greater number of bacteria in the numerator in the pairwise comparison. Total bacterial load in mosquito lines measured by qPCR (f).

