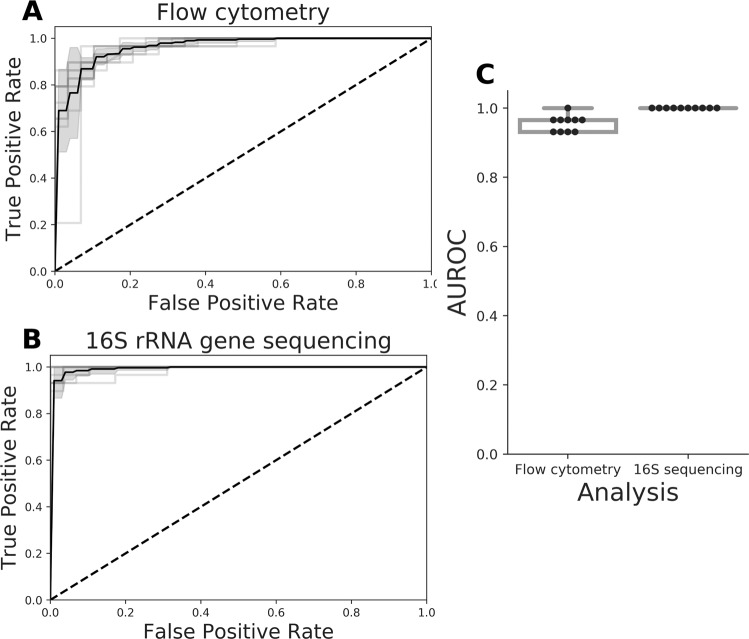
Fig. 1. Summary of Random Forest classification of CD vs. HC test samples for ten runs of the procedure.
The test set was created using leave-pair-out cross-validation. a Average receiver operating characteristic (ROC) curve (black) and standard deviation (SD, gray) for cytometry data. b Average ROC curve (black) and standard deviation (SD, gray) for 16S rRNA gene sequencing data. c Summary of the area under the ROC (AUROC) curves for both types of data, this time based on pairwise averaging of the test set. Each black dot represents the AUROC for an individual run, along with a visualization of the median. A boxplot displays the first and third quartile and the median line. Whiskers extend from the quartiles to 1.5 times the interquartile range.

