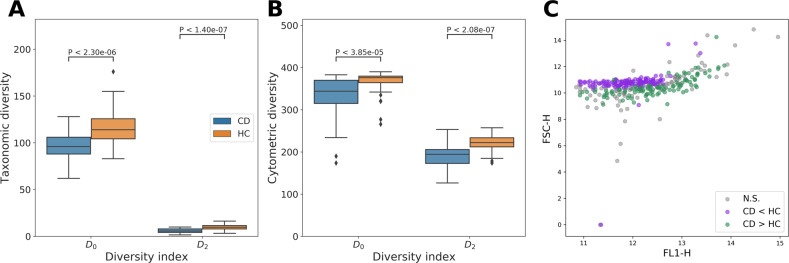
Fig. 2. Microbial diversity estimations and cytometric structure for CD (n = 29) vs. HC (n = 66).
Statistical differences were assessed using a Mann–Whitney U test. Each boxplot displays the first and third quartile and the median line. Whiskers extend from the quartiles to 1.5 times the interquartile range. Points that lie outside this range are visualized as outliers. a Within-sample diversity based on genus abundances as derived from 16S rRNA gene amplicon sequencing. b Within-sample diversity based on cytometric fingerprinting. c Location of the means of each flow cytometric operational group in the FL1-H–FSC-H scatterplot. Groups are annotated whether they contain significantly more cell counts for CD than HC (CD > HC), significantly less cell counts for CD than HC (CD < HC) or whether differences were not significant (NS), P-values were corrected for multiple testing using a Benjamini–Hochberg correction.

