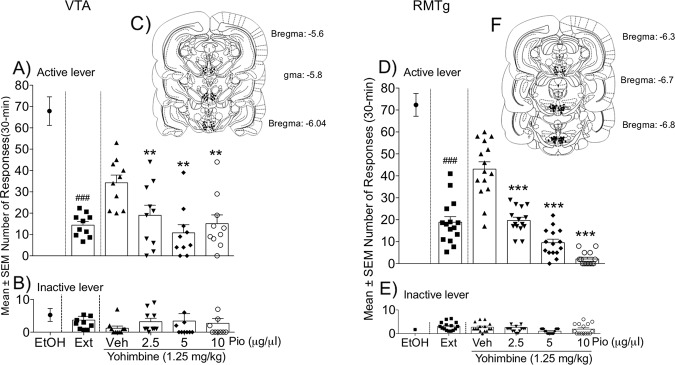
Fig. 5. Effect of intra-RMTg and intra-VTA pioglitazone administration on the yohimbine-induced reinstatement of alcohol seeking.
a, d Number of responses at the active lever following pioglitazone administration in the VTA and RMTg, respectively. b, e Number of responses at the inactive lever following treatment. Schematic illustration of vehicle and pioglitazone injection sites (dots) in the VTA (c) and RMTg (f). The data are expressed as mean (±SEM) intake. n = 10 for VTA. n = 10 for RMTg. ###p < 0.001, vehicle vs. extinction; **p < 0.01; ***p < 0.001, vehicle- vs. pioglitazone-treated animals.

