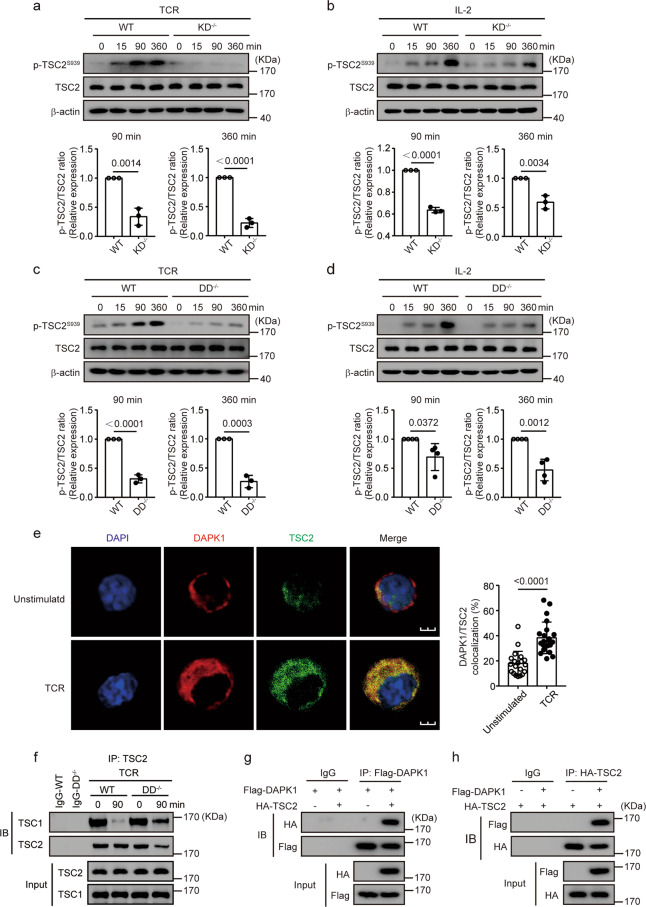
Fig. 3.
DAPK1 interacts with TSC2 in CTLs via its death domain. WT and DAPK1-KD-deficient CTLs were starved overnight with serum-free RPMI 1640 and then stimulated with 2 μg/ml anti-CD3/CD28 (a) or 20 ng/ml rhIL-2 (b) for the indicated times. WT and DAPK1-DD-deficient CTLs were starved overnight with serum-free RPMI 1640 and then stimulated with 2 μg/ml anti-CD3/CD28 (c) or 20 ng/ml rhIL-2 (d) for the indicated times. Phosphorylation of TSC2-Ser939, TSC2, and β-actin was determined by immunoblot analysis (a–d). The band intensities were quantified and analyzed for statistical significance. e WT CTLs were starved overnight with serum-free RPMI 1640 and then stimulated with or without plate-bound anti-CD3/CD28 (2 μg/ml of each) for 60 min. Representative immunofluorescence images of DAPK1 and TSC2 (n = 3 independent experiments with similar results). The percentages of colocalization areas of DAPK1 and TSC2 were quantified and analyzed for statistical significance (20 cells per group). f WT and DAPK1-DD-deficient CTLs were starved overnight with serum-free RPMI 1640. After that, cells were unstimulated or stimulated with anti-CD3/CD28 (2 μg/ml of each) for 90 min. Cell lysates were precipitated with anti-TSC2 antibodies, and immune complexes were analyzed with antibodies against TSC1 and TSC2. g, h HEK293T cells were cotransfected with plasmids of Flag-DAPK1 and HA-TSC2. Cells were cultured for another 36 h after transfection. Cell lysates were harvested and precipitated with anti-Flag (g) or anti-HA (h) antibodies. The immune complexes were separated by 10% SDS-PAGE, followed by immunoblot analysis with anti-Flag or anti-HA antibodies. The data shown are representative of three independent experiments. Statistical significance was measured by the unpaired Student’s t test (a–e). Error bars represent the mean ± SD

