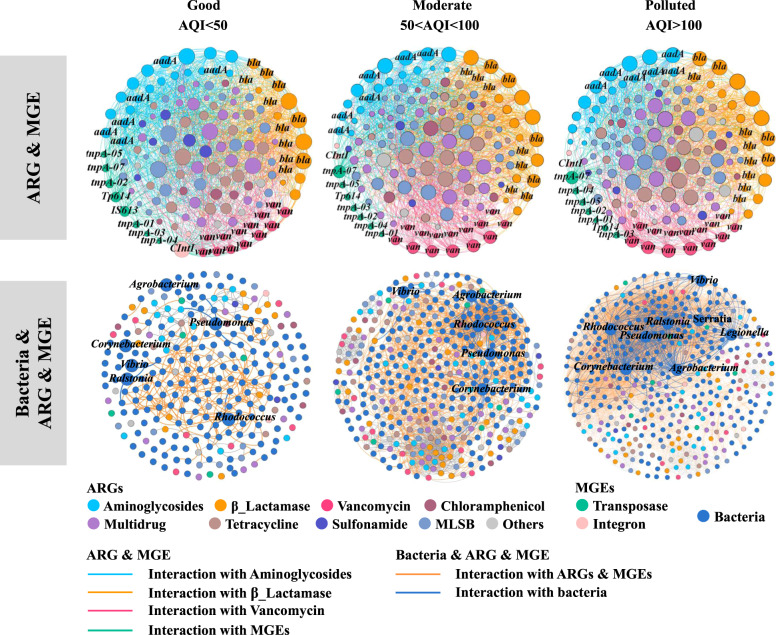
Fig. 2. Overview of the networks of ARG and MGE and bacteria and ARG and MGE in snow under different categories of air quality.
In the ARG and MGE networks, nodes and edges are colored according to the homology of ARGs and MGEs. The nodes with a high degree of significance are labeled, being classified into the aadA family, vancomycin resistance, the class A and C β-lactamase families, and transposase, respectively. Node size was proportional to node degree; edges represent interactions between nodes. In the bacterial and ARG and MGE networks, nodes were colored for the types of ARGs and genera of bacteria. Edges were colored for the interactions with ARGs and bacteria, respectively (see Supplementary Tables S7 and S8 for detailed network parameters).

