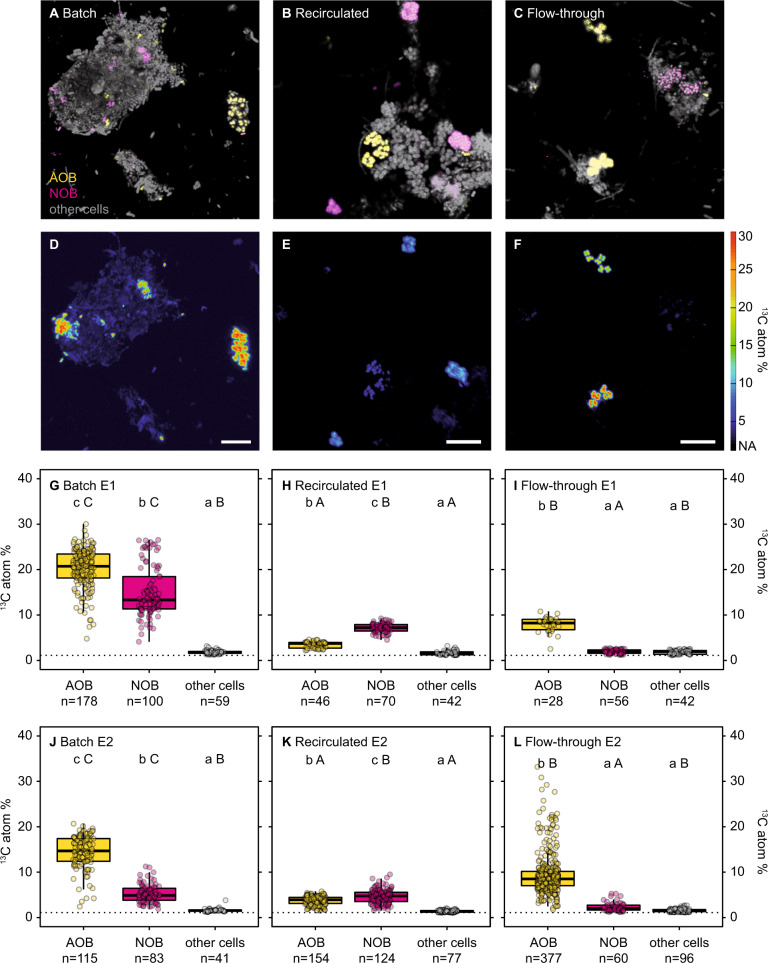
Fig. 2. Single cell isotope probing of nitrifying activated sludge in batch, recirculated, and flow-through incubations.
a–c Show representative FISH images of E2 (AOB in yellow; NOB in magenta; other cells counterstained by DAPI in gray) of batch, recirculated, and flow-through incubations, respectively, and d–f show the corresponding nanoSIMS images. Scale bar is 10 µm in all images. g–l Show 13C labeling of AOB, NOB, and other cells quantified by nanoSIMS at the single-cell level for E1 (g–i) and E2 (j–l) in batch, recirculated, and flow-through incubations, respectively. We used FISH probe sets targeting AOB (Nitrosomonas oligotropha cluster (Cl6a192), Nitrosomonas eutropha/europea/urea cluster (NEU)) and NOB (Nitrotoga (Ntoga122), Nitrospira Lineage 1 (Ntspa1431), and Nitrospira Lineage 2 (Ntspa1151)), respectively, for differential staining of the two nitrifier groups. In (g–l), dashed lines give the 13C natural abundance values of the filter surface. The number of cells analyzed per group is indicated below each boxplot. For each experiment, lower case letters indicate significant difference in 13C labeling between groups (AOB, NOB, other cells) within an incubation type and upper case letters indicate significant difference between incubation types for a given group (Kruskal–Wallis test followed by Dunn’s test; Statistics are given in Table S2). Boxplots depict the 25–75% quantile range, with the center line depicting the median (50% quantile) and whiskers encompass data points within 1.5× the interquartile range.

