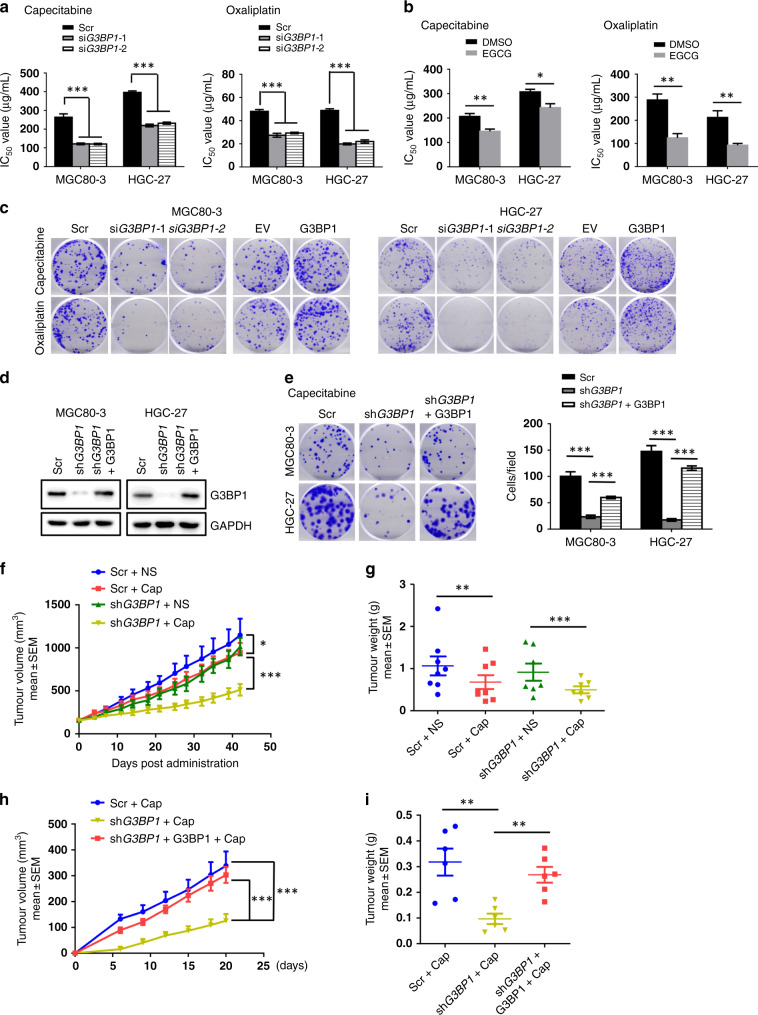
Fig. 2. G3BP1 enhances gastric cancer resistance to chemo-drugs in vitro and in vivo.
a MGC80-3, HGC-27 cells were transfected with scramble or siG3BP1 and treated with capecitabine or oxaliplatin at gradient concentrations for 24 hours, and the IC50 values were examined by CCK-8 assay. Data were shown as mean ± SD of three independent experiments. ***P < 0.001. b The IC50 values of capecitabine and oxaliplatin combined with or without EGCG treatment (25 μM, 48 h) were examined by CCK-8 assay. Data were shown as mean ± SD of three independent experiments. *P < 0.05, **P < 0.01. c Representative images of colony formation assay of MGC80-3 and HGC-27 cells transfected with the indicated siRNAs or plasmids under capecitabine (16 μg/mL) or oxaliplatin (2 μg/mL) treatment. Scale bar: 5 mm. d Immunoblotting analysis (IB) of G3BP1 protein expression in MGC80-3 and HGC-27 cells stably transfected with the indicated plasmids. e Cells generated in d were assessed for colony formation ability under capecitabine (16 μg/mL, 2 weeks) treatment. Scale bar: 5 mm. The statistic results of colony formation assay were shown on the right panel. Data were shown as mean ± SD of three independent experiments. ***P < 0.001. f, g The stable MGC80-3 cell lines were generated after transfection with scramble or shG3BP1 plasmids and then 1 × 10⁷ cells were injected subcutaneously into 6-week-old nude mice. Starting 2 weeks later, mice were randomly allocated into the chemotherapy group (injection with 200 mg/kg capecitabine intraperitoneally, three times per week) or control group (normal saline). After 6 weeks post injection, tumour growth curves were constructed (f), and dissected tumours were collected and weighed (g). Data represented the mean ± SEM. Two-way ANOVA analysis was used to compare the difference between groups. *P < 0.05, **P < 0.01 and ***P < 0.001. h, i Different groups of MGC80-3 cells (1 × 10⁷ cells) were injected subcutaneously into the flanks of 6-week-old NOD-SCID mice. At 6 days after the injection, three groups of NOD-SCID mice were injected with capecitabine intraperitoneally (100 mg/kg, two times per week). Tumour size was monitored (h), and dissected tumour were weighed (i). Data represented the mean ± SEM. Two-way ANOVA analysis was used to compare the difference between groups. **P < 0.01 and ***P < 0.001. Scr scramble, DMSO dimethylsulfoxide, EGCG epigallocatechin gallate, EV empty vector, NS normal saline, cap capecitabine.

