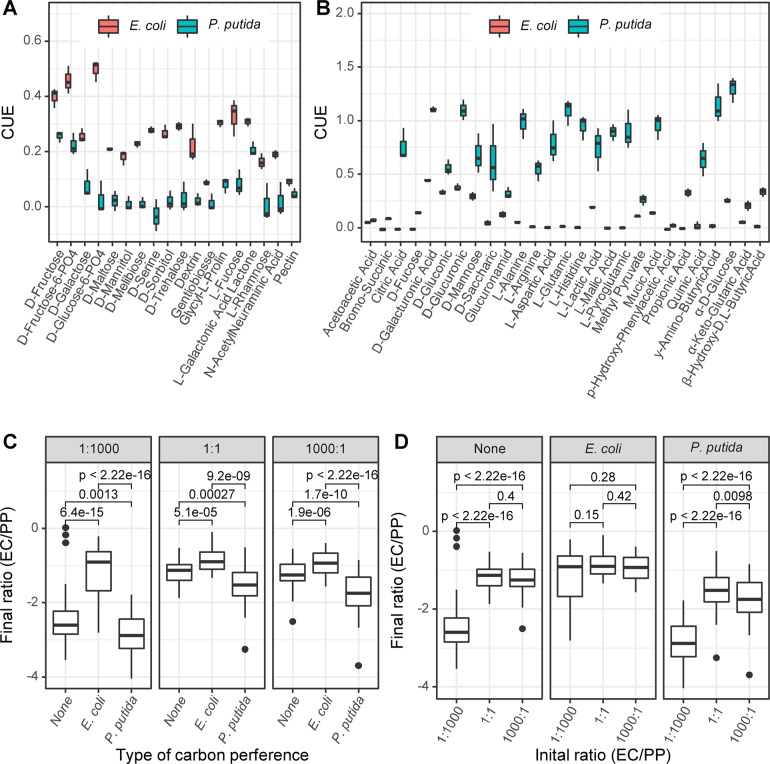
Fig. 3. Carbon preferences.
Among 71 different carbon sources, there were 18 E. coli-preferred (a) carbon sources and 27 P. putida-preferred (b) carbon sources. The x-axis is the name of carbon sources, and the y-axis is the CUE of monocultures. c Comparison of the final ratios of a given coculture in different types of carbon sources defined by preference. The x-axis is the type of carbon preference, and the y-axis is the final ratio (log10 transformed). Left: the “1:1000” coculture; middle, the “1:1” coculture; right: the “1000:1” coculture. d Comparison of the final ratios between three cocultures in a given type of carbon source. The x-axis indicates coculture initial ratios, and the y-axis is the final ratio (log10 transformed). Left: in nonpreferred carbon sources (none); middle: in E. coli-preferred carbon sources; right: in P. putida-preferred carbon sources. The p-values given on the top of bracket in (c, d) were calculated by pairwise Wilcoxon rank sum test.

