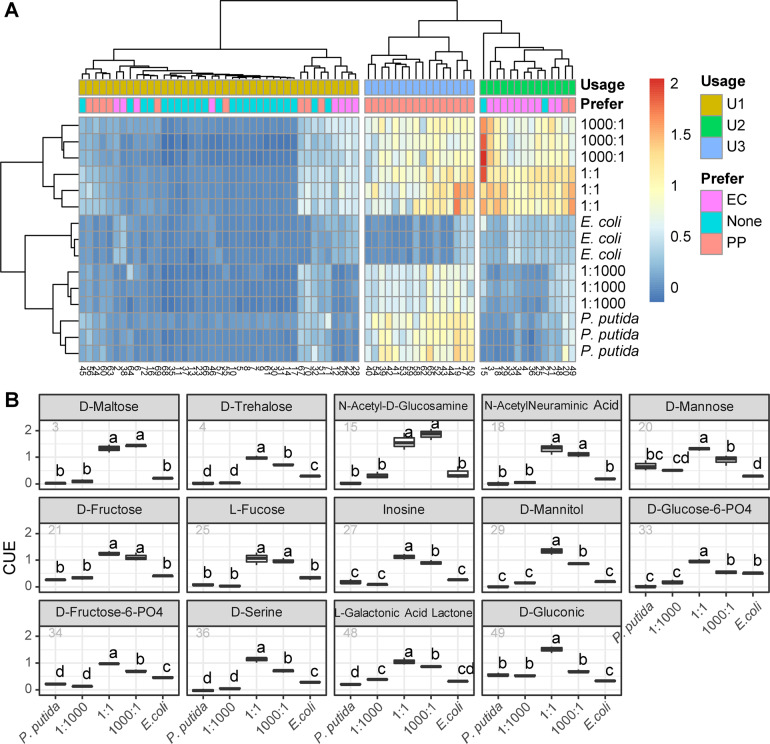
Fig. 4. The initial ratio regulates carbon usage profiles of cocultures.
a Clustering of carbon sources by usage groups. In the heatmap, the type of carbon source is indicated by bars on the top, the carbon ID is indicated on the bottom, and experimental replicates are given on the right. The legend bar indicates the range of CUE values. b The CUE of mono- and cocultures with 14 U2 carbon sources (from left to right, top to bottom). The x-axis indicates culture conditions, and the y-axis indicates CUE. ANOVA and Tukey’s multiple comparisons test were performed. The text on the boxplot indicates whether significant variances were observed between different cultures.

