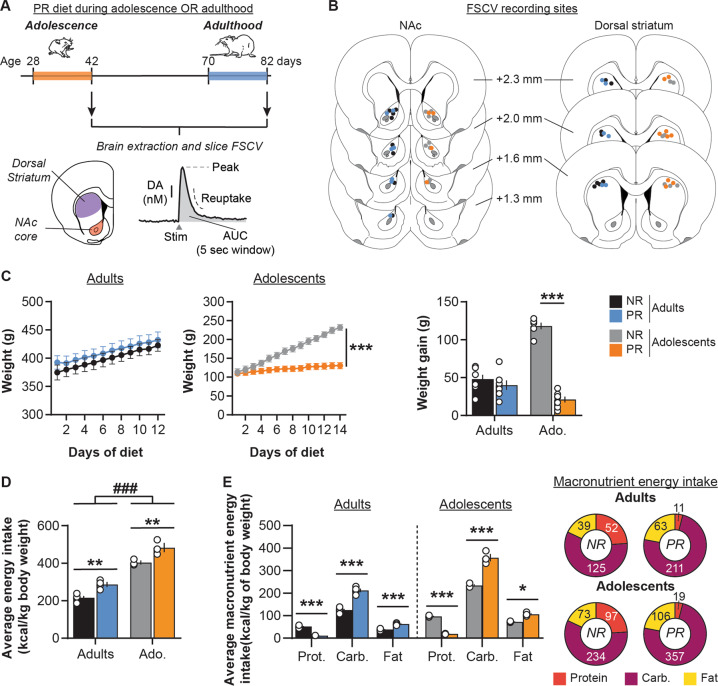
Fig. 1. Impact of protein restriction during adulthood or adolescence on body weight and food intake.
a Schematic representation of the experimental design. Rats had access to either control chow diet (18% protein; non-restricted, NR) or protein-restricted diet (5% protein; PR) during either adolescence (postnatal days 28–42) or adulthood (postnatal days 70–82). At the end of the diet exposure, brains were extracted to perform FSCV recordings of electrically evoked dopamine (DA) release in the NAc core and dorsal striatum. DA release was measured using peak of release, area under the curve (AUC, calculated on 5 s time window post stimulation) and reuptake. b Coronal brain sections (modified from [83]) representing the recording sites in the NAc (left) and the dorsal striatum (right) for NR and PR groups. Numbers indicate the distance from Bregma. c Protein restriction during adolescence but not during adulthood altered weight (left and middle) and weight gain (right). d Daily energy intake (in kcal/kg of body weight) is higher in adolescent rats compared to adults, and in PR groups compared to control NR groups. e Macronutrient breakdown for daily energy intake during the diet exposure (in kcal/kg of body weight). Pie charts represent energy intake from each macronutrient for each diet group (Protein: red; Carbohydrate: purple; Fat: yellow). Adults NR, n = 8, black symbols; Adults PR, n = 7, blue symbols; Adolescents NR, n = 6, gray symbols; Adolescents PR, n = 7, orange symbols. Data are mean ± SEM and circles show individual (e.g., rats for C and cages for D) data points. *p < 0.05, **p < 0.01, ***p < 0.001 Diet effect (two-way ANOVA followed by Sidak’s post hoc tests), ###p < 0.001 Age effect (two-way ANOVA).

