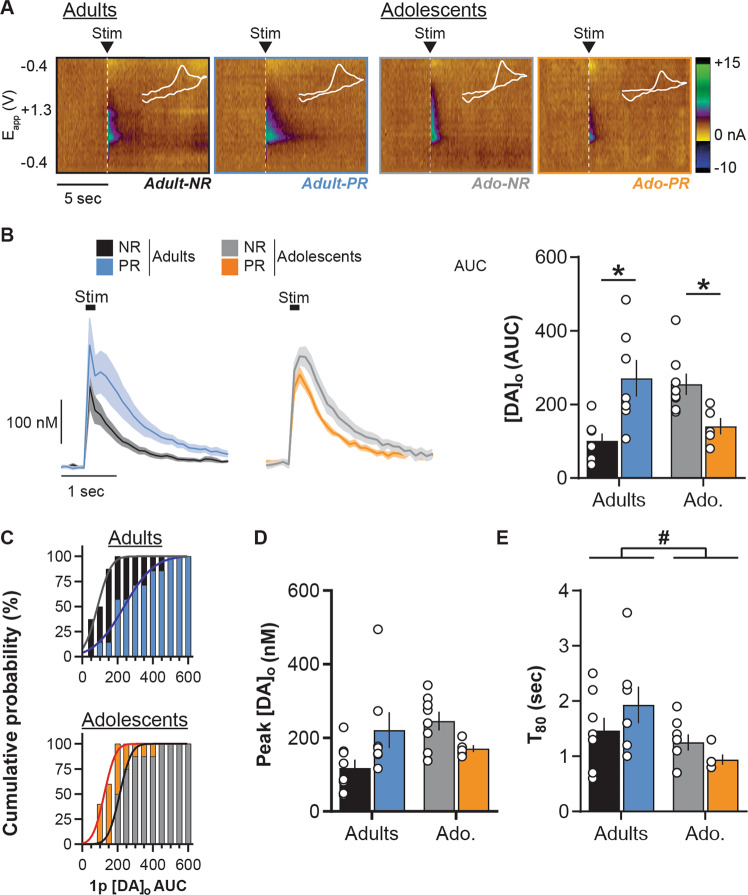
Fig. 2. Age-dependent impact of protein restriction on NAc dopamine release evoked by single pulse.
a Representative FSCV color plots for each diet group (non-restricted, NR; protein-restricted, PR) depicting current changes (color) over time (x-axis; in sec) as a function of the recording electrode holding potential (y-axis; −0.4 to +1.3 V and back) in response to single pulse electrical stimulation (0.7 mA, 0.2 ms; vertical white dashed lines). White line insets represent voltammograms for each color plot. b Left: NAc [DA]o versus time (in nM; mean ± SEM) in slices from adult and adolescent NR and PR rats, aligned to the single pulse electrical stimulation (black box). [DA]o peaks and AUC were calculated after the end of the stimulation; Right: Mean [DA]o release (AUC calculated on a 5 sec time window post stimulation) evoked by single pulse stimulation in the NAc. c Cumulative distribution of single pulse evoked NAc [DA]o AUC in adult (top) and adolescent (bottom) groups. d Mean [DA]o peak evoked by single pulse stimulation in the NAc. e Average T80 (time for 80% decay from [DA]o peak) in the NAc. Adults NR (black, n = 8/5 rats), Adults PR (blue, n = 7/3 rats), Adolescents NR (gray, n = 9/5 rats) and Adolescents PR (orange, n = 5/3 rats). Bars show means ± SEM and circles show individual (e.g., recording site) data points. *p < 0.05 Diet effect (Student’s unpaired t test), #p < 0.05 Age effect (two-way ANOVA).

