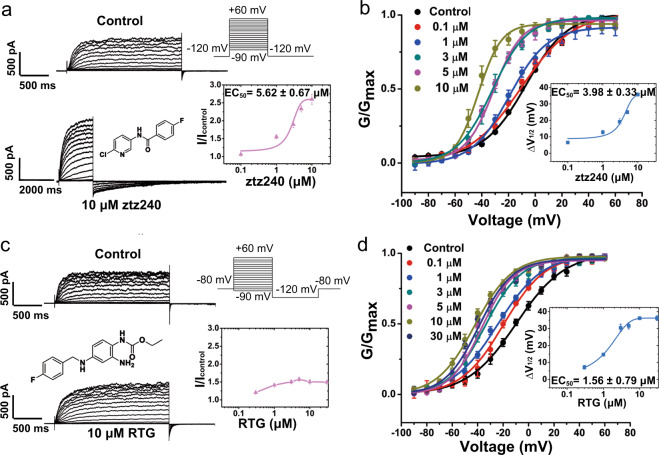
Fig. 1. ztz240 and RTG activation on KCNQ2.
a The representative current traces of KCNQ2, before (upper traces) and after (lower traces) application of 10 μM ztz240. The inset (left) shows the chemical structure of ztz240. The inset (right) shows the dose–response curve of ztz240 effects on outward current of KCNQ2 at +50 mV, where the ratio of outward current amplitude in the presence of compound (I) versus that in the absence of compound (Icontrol) was plotted against agonist compound concentration. b Voltage activation curves for KCNQ2 generated in the absence and presence of ztz240. The inset shows the concentration–response curve for KCNQ2 channel. ΔV1/2 = V1/2 in control − V1/2 in the presence of ztz240. c The representative current traces of KCNQ2, before (upper traces) and after (lower traces) application of 10 μM RTG. The inset (left) shows the chemical structure of RTG. The inset (right) shows the dose–response curve of RTG effects on outward current of KCNQ2 channel at +50 mV. d Voltage activation curves for KCNQ2 generated in the absence and presence of RTG. The inset shows the concentration–response curve for KCNQ2 channel.

