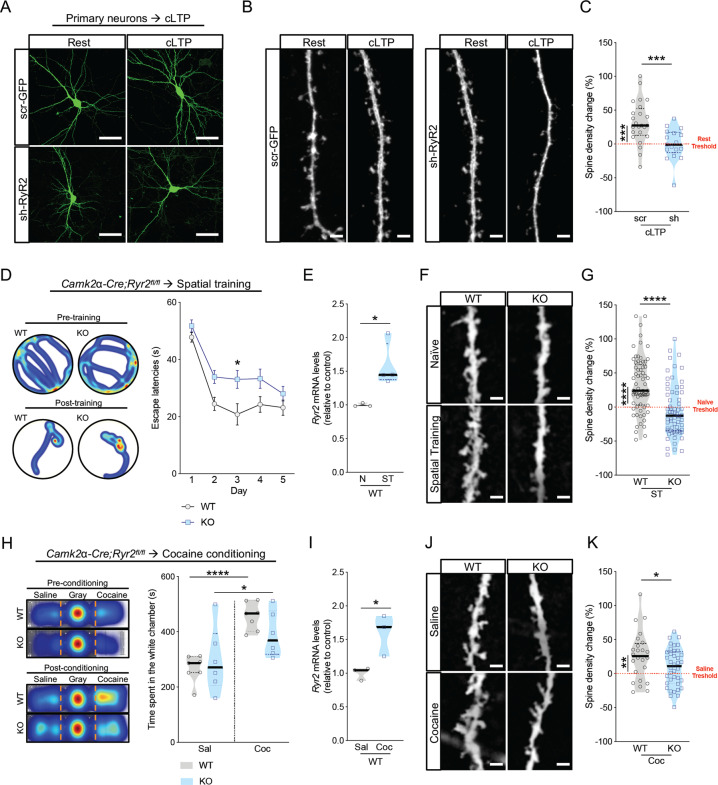
Fig. 2. RyR2 mediates activity-dependent structural plasticity of dendritic spines in the hippocampus.
a, b Representative pictures of transfected scramble and sh-RyR2 DIV14 neurons kept in resting condition or treated with cLTP. Neurons, scale bar: 50 μm. Dendritic spines, scale bar: 2 μm. c Spine density change in scramble (scr) and sh-RyR2 (sh) neurons treated with cLTP and compared to cells at rest (n = 3, scramble: n = 29 cells, scramble cLTP: n = 24 cells, sh-RyR2: n = 30 cells, sh-RyR2-cLTP: n = 19 cells). d–g Control (WT) and Camk2α-Cretg/wt;Ryr2fl/fl mice (KO) trained in the Morris Water Maze, a paradigm of hippocampal structural plasticity. d Heatmaps and escape latencies over training days in the Morris Water Maze of control (WT) and Camk2α-Cretg/wt;Ryr2fl/fl (KO) mice (WT: n = 13, KO: n = 18). e qRT-PCR of Ryr2 mRNA expression of hippocampal samples from naïve- (N) and spatial trained- (ST) control mice (WT naïve: n = 3, WT spatial trained: n = 4). f, g Spine density change in apical dendrites (WT naïve: n = 47 cells/5 mice, WT spatial trained: n = 69 cells/7 mice, KO naïve: n = 48 cells/5 mice, KO spatial trained: n = 66 cells/7 mice) of CA1 neurons induced by spatial training (24 h after the last training) in control (WT) and Camk2α-Cretg/wt;Ryr2fl/fl (KO) mice compared to naïve control (WT) and Camk2α-Cretg/wt;Ryr2fl/fl (KO) mice. Scale bar: 2 μm. h–k Control (WT) and Camk2α-Cretg/wt;Ryr2fl/fl (KO) mice subjected to cocaine-induced conditioned place preference (CPP) test, a second paradigm of hippocampal structural plasticity. (H) Heatmaps and contextual place preference score of the time spent in the CPP apparatus (white chamber) pre- and post- 6 days of alternated cocaine conditioning using control (WT) and Camk2α-Cretg/wt;Ryr2fl/fl (KO) mice (WT saline: n = 7, WT cocaine: n = 7, KO saline: n = 6, KO cocaine: n = 6). i qRT-PCR of Ryr2 mRNA expression of hippocampal samples from saline- (Sal) and cocaine- (Coc) treated control mice (WT saline: n = 3, WT cocaine: n = 3). j, k Spine density change 24 h after the post-conditioning test in apical dendrites (WT naïve: n = 23 cells/3 mice, WT cocaine: n = 24 cells/4 mice, KO naïve: n = 32 cells/4 mice, KO cocaine: n = 47 cells/6 mice) of CA1 neurons in cocaine (Coc)-treated control (WT) and Camk2α-Cretg/wt;Ryr2fl/fl (KO) mice compared to saline-treated control (WT) and Camk2α-Cretg/wt;Ryr2fl/fl (KO) mice. Scale bar: 2 μm. Data are reported as median [25th and 75th percentile]. Unpaired Student’s t test or Two-way RM ANOVA with Bonferroni post hoc comparison, ****p < 0.0001, ***p < 0.001, *p < 0.05.

