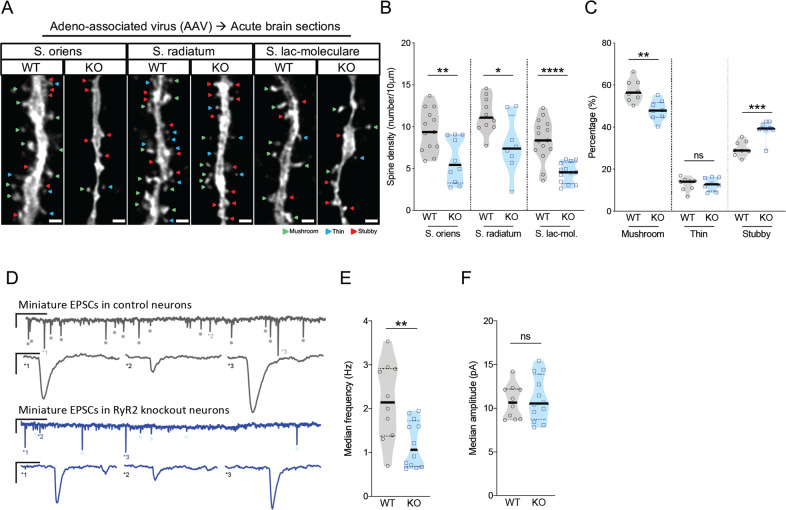
Fig. 3. Post-developmental RyR2 deletion leads to loss of excitatory synapses.
a Representative images of dendrites of stratum oriens, stratum radiatium and stratum lacunosum-moleculare of stereotaxically injected AAV.Camk2α.GFP (control, WT) and rAAV.Camk2α.GFP-cre (RyR2 knockout, KO) mice. Different spine morphologies: mushroom (green), thin (blue) and stubby (red). Scale bar: 1 μm. b Spine density in dendrites of the stratum s. oriens (WT: n = 13 cells/9 mice, KO: 10 cells/5 mice), s. radiatum (WT: n = 10 cells/7 mice, KO: 8 cells/4 mice) and s. lacunosum-moleculare (WT: n = 15 cells/9 mice; KO: 13 cells/6 mice). c Percentage of mushroom, thin and stubby dendritic spines in control (WT) and RyR2 knockout (KO) pyramidal neurons (WT: n = 8 cells/6 mice, KO: 8 cells/6 mice). d Representative examples of miniature EPSCs measurements in control and RyR2 knockout CA1 pyramidal cells. Scale bars: 10pA, 1 s and 10 pA, 25 ms. e, f Summary of the measured miniature EPSCs in control (WT) and RyR2 knockout (KO) neurons (WT: n = 10 cells/4 mice/7821 EPSCs, KO: 12 cells/5 mice/5057 EPSCs) for e the instantaneous EPSC frequency and f the EPSC amplitude. Data are reported as median [25th and 75th percentile]. Unpaired Student’s t test or Two-way ANOVA with Bonferroni post hoc comparison. ****p < 0.0001, ***p < 0.001, **p < 0.01, *p < 0.05.

