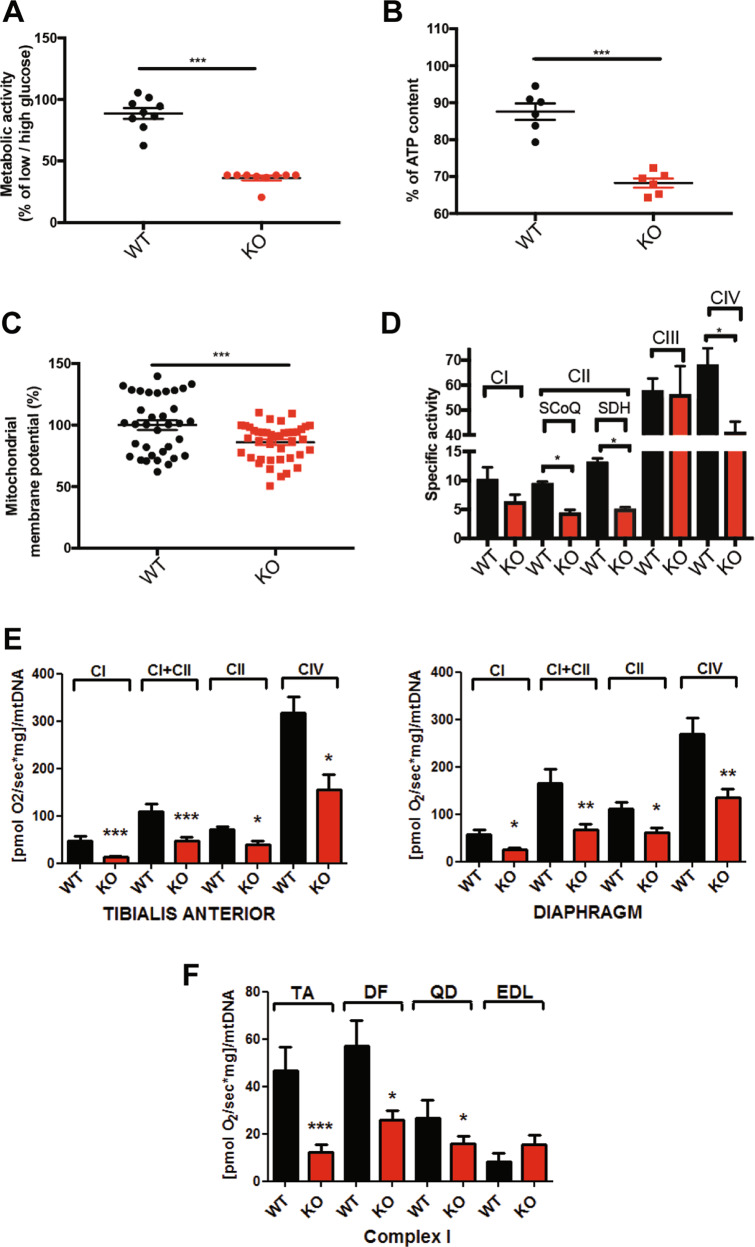
Fig. 3. SEPN1 controls mitochondria bioenergetics.
a Percentage of the ratio of the metabolic activity (MTS assay) of WT and SEPN1 KO HeLa cells between 2 days of culture in low glucose (5.5 mM) and high glucose (25 mM) (N = 9). b Measurement of cellular ATP content in WT and SEPN1 KO HeLa cells. Results from three independent experiments are summarized as a graph (N = 6). c Analysis of mitochondrial membrane potential (Ψm) as measured by TMRM intensity in WT and SEPN1 KO HeLa cells (N = 34). d Mitochondrial respiratory chain specific activity in WT and SEPN1 KO C2C12 (N = 4). e Oxygraphy studies of mitochondrial complexes in tibialis anterior and diaphragm muscles from Sepn1 KO mice (red bars) compared with WT animals (black bars). f Complex I activity in tibialis anterior (TA), diaphragm (DF), quadriceps (QD), and extensor digitorum longus (EDL).

