Fig. 2.
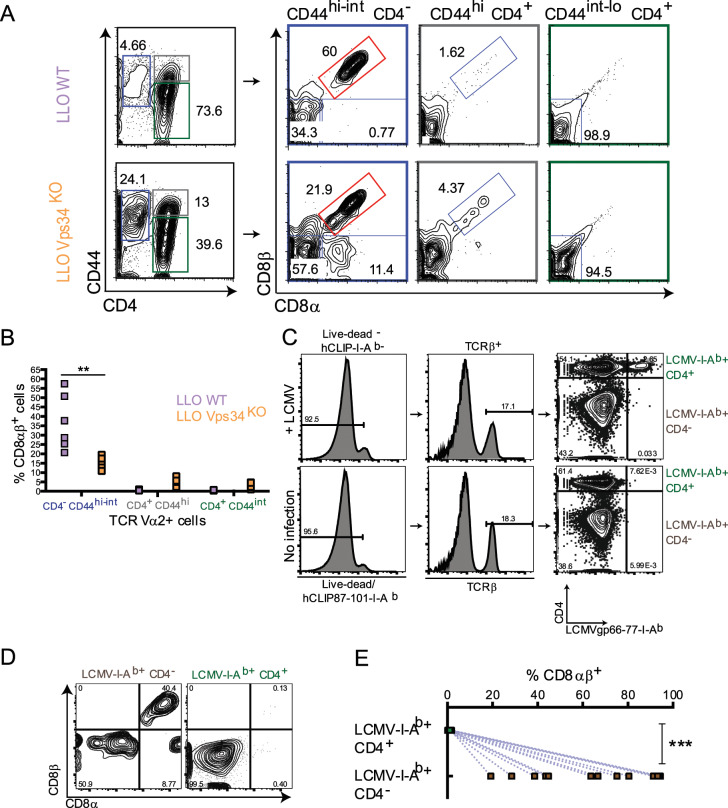
CD4-CD8αβ+ MHCII-recognizing effector T cells are generated during acute infection. Acute Listeria monocytogenes infection (a, b) LLO WT and LLO Vps34KO mice were infected with 1 × 10⁷ cfu Listeria monocytogenes by intravenous (i.v.) injection. a Four days post-infection, splenic lymphocytes were harvested and analyzed for the presence of naïve CD4+ T cells (CD44int-lo TCR Vα2+ CD4+, marked in green), effector CD4− T cells (CD44int-hi TCR Vα2+ CD4−, marked in blue) and effector CD4+ T cells (CD44hi TCR Vα2+ CD4+, marked in gray) (left panel). CD8αβ expression was analyzed in each of these populations (right panel). The CD4-CD8αβ+ population is indicated in red. b Frequency of CD8αβ expression within naïve CD4+, effector CD4− and effector CD4+ T cells from Listeria-infected LLO WT and LLO Vps34KO mice. n = 6 from 1 experiment. Statistical significance was determined by the Mann-Whitney U Test; *p < 0.05, **p < 0.01, ***p < 0.001, n.s. = not significant. Acute LCMV Armstrong infection (c–e) Thy1.1+ C57BL/6 mice were infected with 1 × 10⁵ cfu lymphocytic choriomeningitis virus-Armstrong strain (LCMV Armstrong) by intraperitoneal (i.p.) injection. c Seven-8 days postinfection, splenic lymphocytes were harvested and analyzed for the presence of LCMV/MHCIIspecific effector CD4−CD8αβ+ T cells (Live-dead− huCLIP87-101-I-Ab− LCMVgp66-77+-I-Ab+ CD44hi TCRβ+ CD4−, marked in brown) and LCMV/MHCII-specific effector CD4+ T cells (Livedead− huCLIP87-101-I-Ab− LCMVgp66-77+-I-Ab+ CD44hi TCRβ+ CD4+, marked in green). %CD8αβ+ cells in these sub-populations in LCMV-infected mice is shown in (d) and enumerated in (e). n = 13 from 2 independent experiments. Statistical significance was determined by the Mann–Whitney U test; *p < 0.05, **p < 0.01, ***p < 0.001, n.s. = not significant

