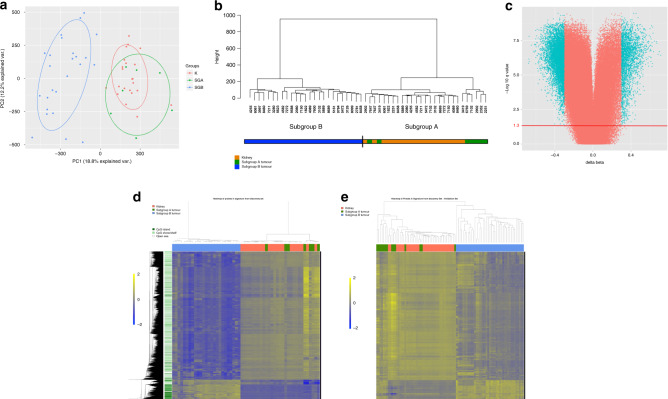
Fig. 1. Clustering of tumour and kidney samples into two subgroups.
a Principal component analysis of all tumour and kidney samples in the discovery set. First two principal components account for 31% of the variance in all probes on the 450K array. b Unsupervised hierarchical clustering of all tumour and kidney samples in the discovery set utilising data from all probes on the 450K array that passed QI steps. Distances are calculated on Euclidean coordinates and relationships are determined by Ward’s minimum variance method. c Volcano plot showing methylation difference between Subgroup B tumours and Subgroup A tumours at each CpG probe (Subgroup B–Subgroup A). Probes with FDR-corrected p values ≤0.05 (−log 10 q value = 1.3—red line) and a difference in methylation (beta value) ≥0.3 are coloured blue. d Heatmap of significantly different CpGs between Subgroup B tumours and Subgroup A tumours for all tumour and kidney samples in the discovery set. Each row represents a differentially methylated probe and each column represents a sample. Distances calculated on Euclidean coordinates and relationships are represented by the UPGMA average linkage method. Regional CpG density is annotated for each probe. Beta values are mean-centred. e Heatmap of the significantly different CpGs defined in the discovery set (c, d) for all tumours and kidneys in the validation set. Each row represents a differentially methylated probe and each column represents a sample. Distances calculated on Euclidean coordinates and relationships are determined by the UPGMA average linkage method. Beta values are mean-centred.

