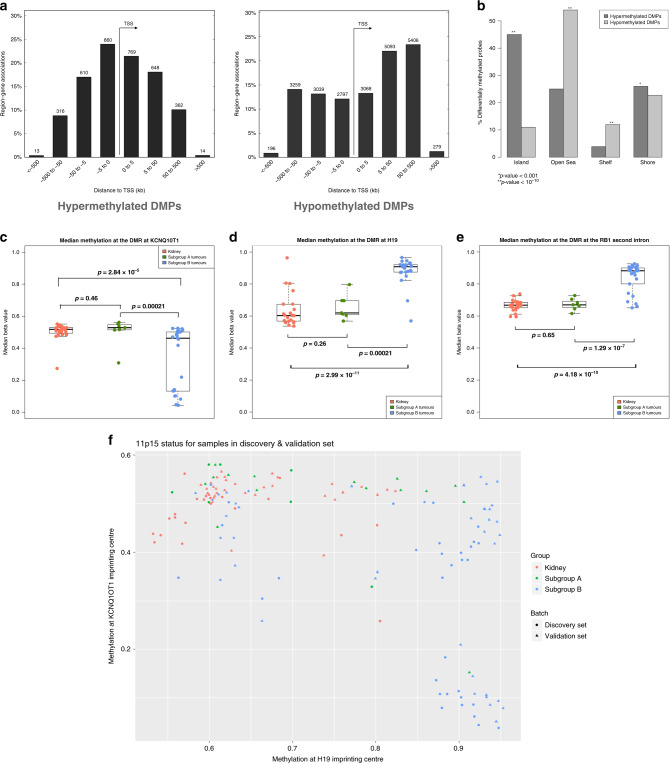
Fig. 2. Characteristics of differentially methylated probes and imprinting control regions in Wilms tumour subgroups.
a Relationship of differentially methylated probes (DMPs) between Subgroup B tumours and Subgroup A tumours to the transition start site (TSS) of the nearest gene. Left: DMPs hypermethylated in Subgroup B. Right: DMPs hypomethylated in Subgroup B. b Relationship of DMPs to CpG Islands. P values calculated by hypergeometric test compared to what would be expected by chance if probes were randomly sampled from all those represented on the array. c–e DNA methylation at selected imprinting control regions for all kidney and tumour samples in the discovery set. Each dot represents the median beta value for each sample at all probes within the imprinting control region. P values between groups of samples are calculated by two-tailed t tests. For each boxplot, the central line represents the median. The box extends to the 1st and 3rd quartiles of the data and the whiskers extend to the furthest data point within 1.5 times the length of the box. c KCNQ1OT1 imprinting control region (chromosome 11p15.5). d H19 imprinting control region (chromosome 11p15.5). e RB1 imprinting control region (chromosome 13q14.2). f Mean DNA methylation at the H19 and KCNQ1OT1 imprinting control region at chromosome 11p15.5 for each sample.

