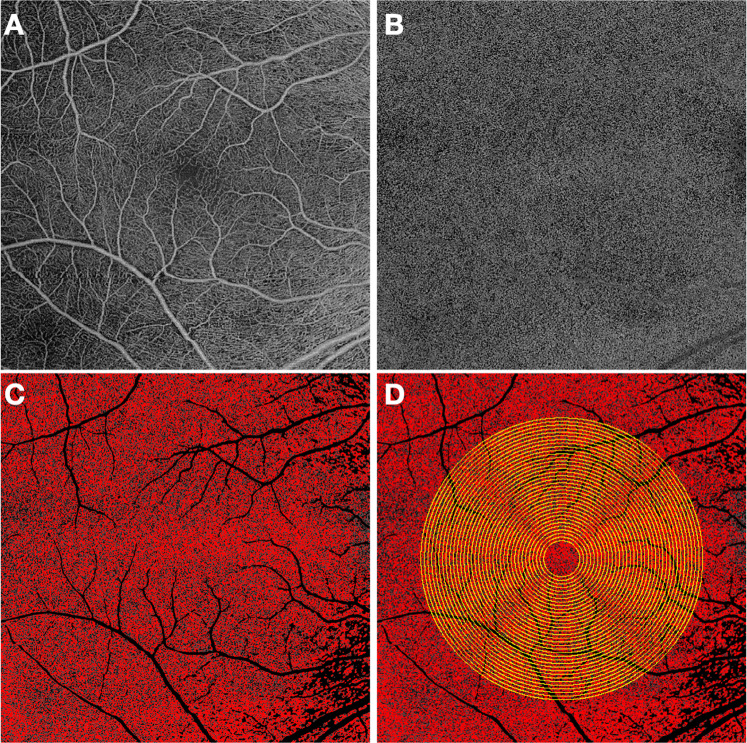
Fig. 2. Process for analysing choriocapillaris flow deficits in different macular regions using a multiple concentric rings grid.
The superficial capillary plexus (A) is used as reference to center the grid in the center of the foveal avascular zone. The en face choriocapillaris (B) angiogram is automatically thresholded after masking the superficial vessels in order to obtain a binarized image (C) where the black pixels correspond to the CC flow deficits (FD). The FDs can be computer within the concentric rings of a grid applied to the image (D). The percentage of flow deficits (FD%) within each ring may then be plotted as a function of distance from the foveal center defined by radius on the ring.

