Fig. 5.
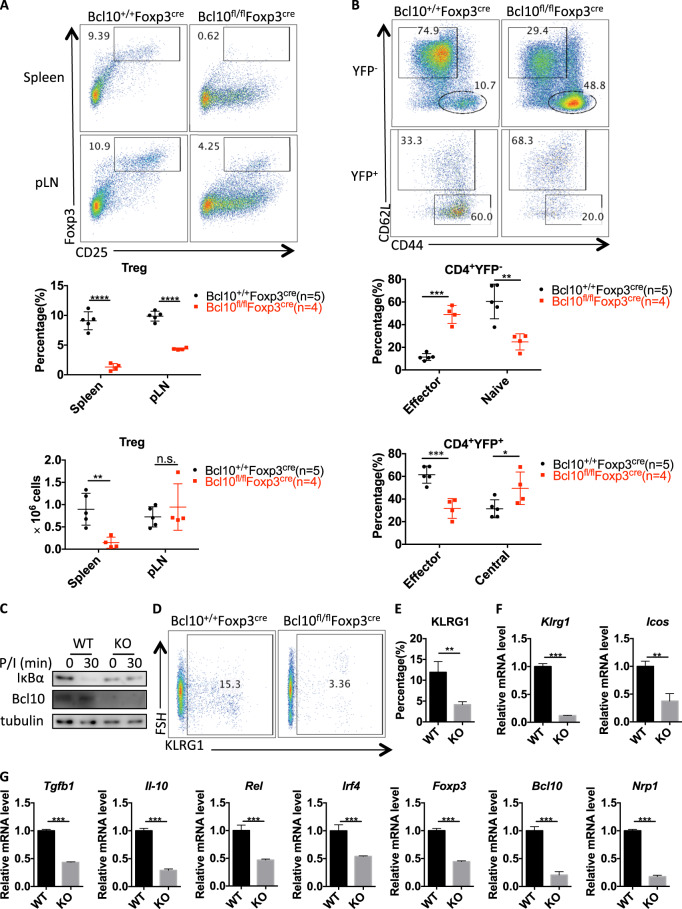
Bcl10 is essential for maintaining the identity and population of Treg cells. Spleens and peripheral lymph nodes from 24-day-old Bcl10+/+Foxp3cre or Bcl10fl/flFoxp3cre mice were analyzed by FACS (n = 5, 4, or 3 per group). a FACS plots represent CD4+CD25+Foxp3+ (Treg) cells gated on the CD4+CD8− cells in the spleen or peripheral lymph nodes (above). Statistical analyses were used to evaluate the CD4+CD25+Foxp3+ cell percentage in the CD4+CD8− cell population and the absolute numbers in the spleen or peripheral lymph nodes (below). b FACS plots represent effector (CD44hiCD62Llo) and naive or central (CD44loCD62Lhi) cells gated on CD4+YFP−(Foxp3−) (above) or CD4+YFP+(Foxp3+) (below) cells in the spleen and lymph nodes (above). Statistical analyses were used to evaluate the effector (CD44hiCD62Llo) and naive or central (CD44loCD62Lhi) cell percentages in the CD4+YFP-(Foxp3-) (above) and CD4+YFP+(Foxp3+) (below) cell populations in the spleen and lymph nodes. c WT (from Bcl10+/+Foxp3cre mice) and Bcl10 KO (from Bcl10fl/flFoxpcre mice) Treg cells were stimulated with PMA (20 ng/mL) and ionomycin (200 ng/mL) for the indicated time, followed by immunoblotting analysis. d FACS plots represent KLRG+ cells gated on the CD4+YFP+ cells in the spleen and lymph nodes. e The percentage of KLRG+ cells gated on the CD4+YFP+ cells in the spleen and lymph nodes (WT: Bcl10+/+Foxp3cre mice (n = 4), KO: Bcl10fl/flFoxp3cre mice (n = 3)) is shown. f and g The mRNA levels of Klrg1, Icos f, Tgfb1, Il-10, Rel, Irf4, Nrp1, Foxp3, and Bcl10 g were measured by qRT-PCR in WT (from Bcl10+/+Foxp3cre mice) and KO (from Bcl10fl/flFoxp3cre mice) Treg cells (CD4+YFP+ cells) (mean ± SEM, n = 3). Student’s t test was used as the statistical test (n.s. = no significance, *p < 0.05, **p < 0.01, and ***p < 0.005). All error bars represent SDs

