Fig. 6.
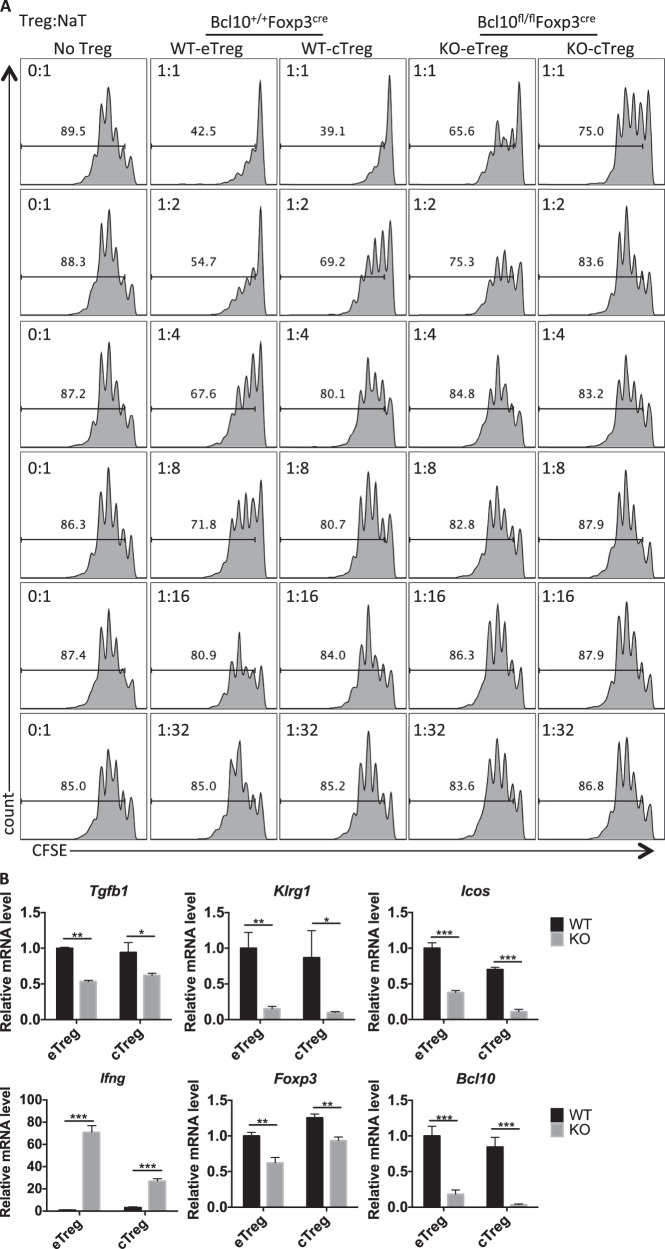
Bcl10 functions in both eTreg cells and cTreg cells. a In vitro suppression assay for eTreg and cTreg cells: CFSE-labeled CD4+ naive T cells (from CD45.1+ mice) cultured alone or cocultured with WT-eTreg, WT-cTreg (from Bcl10+/+Foxp3cre mice), KO-eTreg, or KO-cTreg (from Bcl10fl/flFoxp3cre mice) cells at the indicated ratio in the presence of irradiated splenocytes and an anti-CD3 antibody. b The mRNA levels of Tgfb1, Klrg1, Icos, Ifng, Foxp3, and Bcl10 were determined by qRT-PCR in WT (from Bcl10+/+Foxp3cre mice) and KO (from Bcl10fl/flFoxp3cre mice) eTreg or cTreg cells (mean ± SEM, n = 3). Student’s t test was used as the statistical test (*p < 0.05, **p < 0.01, and ***p < 0.005). All error bars represent SDs

