
Fig. 2. Abundance and expression of the Gamma-A-MATOU nitrogenase gene cluster across size fractions and depths.
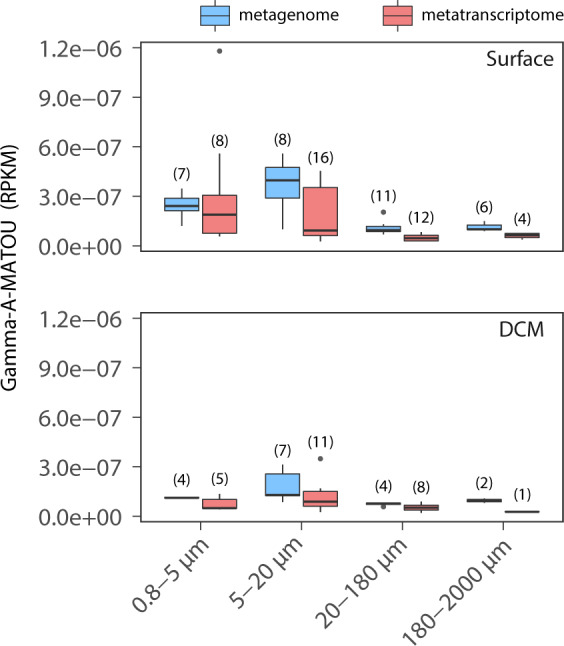
Boxplots representing the abundance (blue) and expression (red) of Gamma-A-MATOU. The number of samples used for the calculation of each boxplot is indicated between parentheses. Abundances of metagenomic and metatranscriptomic reads are expressed as RPKM (Reads Per Kilobase covered per Million of mapped reads).