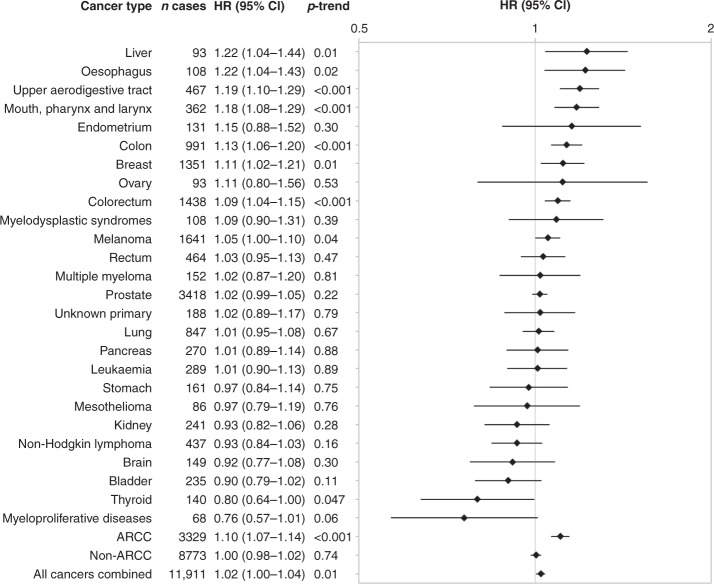
Fig. 1. Hazard ratios (HR) and 95% confidence intervals (CI) of cancer risk per seven-drink increase in weekly alcohol consumption among drinkers in the 45 and Up Study (2006–2013).
Linear trend calculated among drinkers only, where participants within each category of alcohol consumption at baseline were assigned the mean level of alcohol consumption they reported at first-wave follow-up (median 5.3 years after baseline). Models were adjusted for cancer-specific covariates as listed in Supplementary Table 1. Cancer cases do not sum to totals as some participants were diagnosed with two or more primary cancers. ARCC alcohol-related cancers combined.

